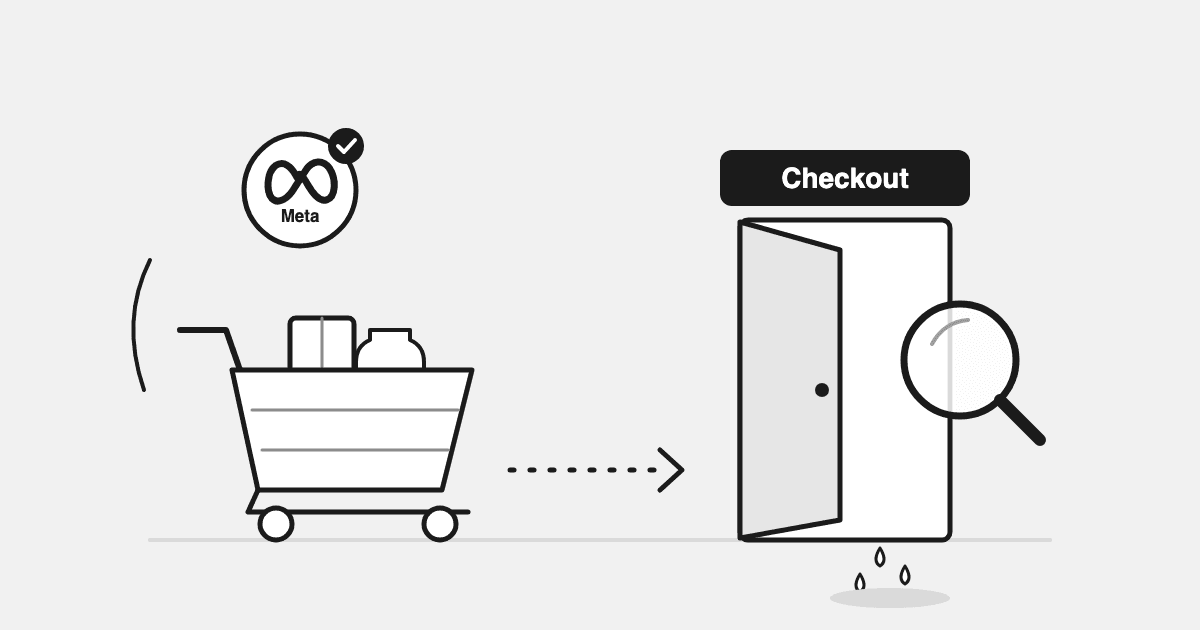
If shoppers add to cart but don't reach checkout, the problem is almost always on your site, not in your ads. Ads that bring people all the way to add-to-cart are doing their job. In a three-month review of one Shopify brand, only about 1 in 5 carts reached checkout. A healthy store gets half or more. That one step cost roughly ten times more than every ad problem in the account combined. The fix order: check tracking first, then hold ad delivery (CPM, CTR, spend) against each funnel step, then size both leaks in money before you change anything.
The numbers below come from three Shopify brands that asked Drew, DataDrew's AI ads agent, the same question in September 2026: "Is it my ads or my site?" Figures are rounded. Each got a different answer. The method that found it was the same.
TL;DR
- The finding: one brand's ads were fine-ish (blended ROAS about 3.4x). Its checkout step was losing about 4 in 5 carts, almost all on mobile.
- Ads get people to the cart. Your site gets them through checkout. If add-to-cart is healthy and checkout starts are not, stop looking at the ad account.
- Check tracking before anything else. This account had duplicate purchase events, a payment event that barely fired, and about 10% of sessions with no source.
- Size both leaks in money. Wasted ad spend was about 2% of Meta spend. The cart-to-checkout gap was worth roughly ten times every ad inefficiency combined.
- Use the table below to match what moved to where to look.
Why do shoppers add to cart but not check out?
Because something between the cart and the checkout page stops them. The ad already did its job: it found someone who wanted the product enough to tap "add to cart".
The usual causes, in the order we see them:
- Mobile friction. A cart drawer that won't scroll, a chat bubble over the checkout button, a slow page on a phone.
- Cost surprise. Shipping, taxes or a minimum order that shows up only in the cart.
- Trust or payment gaps. The payment method they want isn't there, or the checkout looks like a different site.
- A third-party checkout. Every extra redirect loses people, and it often breaks your tracking too.
- Nothing at all: it's a tracking error. The carts did reach checkout, but the event that records it never fired.
Number 5 is why you check tracking before you touch anything else.
Is it my ads or my website?
Hold your ad delivery metrics against your funnel step rates, in the same window. Whichever side moved is where the problem is.
Ads control who arrives and what it costs: CPM, CTR, spend, and the quality of the click. Your site controls everything after the click: product view to cart, cart to checkout, checkout to order. If CPM and CTR held and a funnel step fell, the ads didn't cause it.
Here is what that looked like across three brands in one month.
Brand one: a checkout leak. A founder asked Drew for a three-month review of paid ads plus the full website funnel. The ads had real problems, but small ones. The funnel had one big one: only about 1 in 5 carts reached checkout, and nearly all traffic was mobile.
Brand two: a payment-step drop that ads were amplifying. Sessions were almost flat day over day. Add-to-cart fell about a fifth. Checkout completion fell by about a quarter. CPM was cheaper and CTR was flat, which rules out creative fatigue and auction cost. Drew's verdict: "Not an ads problem first, a site-conversion problem ads are amplifying." The advice was to change nothing in the ad account and test checkout, payment and discount codes instead.
Brand three: a demand drop. Traffic halved overnight across every channel, including ones with no ad spend, and stayed there. Google spend was flat, but conversion value fell the same day. When organic and direct fall with paid, it isn't the ads and it isn't the checkout. Demand moved.
Three stores asked the same question and got three different answers. The method that found each one was the same.
Check tracking before you diagnose anything
A broken event can fake a funnel leak or hide one. Brand one had three tracking problems. All are common.
- Duplicate purchase events on Meta. The account had several overlapping purchase events. Optimise to the wrong one and reported revenue can be overstated by up to 5x. Pick one purchase event, confirm it matches Shopify orders, and turn the rest off as optimisation goals.
- A payment event that barely fires. `add_payment_info` almost never fired, because checkout ran on a third-party page the pixel couldn't see. Any funnel step after the handoff was blind. Fix the integration or stop reading that step.
- Unassigned sessions. About 10% of GA4 sessions had no source. That traffic still converts, but you can't tell whether ads sent it. Fix UTMs on every link you control.
Example: one order, five purchase events. The numbers are illustrative. A shopper places a $60 order. The browser pixel fires a purchase. The server-side event fires again without a shared event ID, so Meta can't merge the two. A theme app added its own pixel, which fires a third. A post-purchase upsell app fires a fourth. The shopper reloads the thank-you page, and that's five. Meta now shows five purchases worth $300 for one $60 order.
Scale it to a week. 100 real orders worth $6,000 show up in Meta as $30,000. On $5,000 of spend, Meta reports 6x ROAS. Shopify says the whole store took $6,000, so the true return can't be above 1.2x. Every funnel step built on those events is wrong too.
The quick test: compare the orders your analytics shows against actual Shopify orders for the same days. If they disagree by more than a few percent, fix that first. Our daily ROAS root-cause framework makes this Layer 1 for the same reason.
What did the ads side look like?
Mixed, and mostly fixable in an afternoon.
- Blended ROAS about 3.4x over three months.
- Google about 8x on under a tenth of spend. Efficient, and probably under-funded.
- Meta about 90% of spend at about 2.9x. As Meta spend rose about 60% month on month, its ROAS fell from roughly 3.7x to 3.2x. That is a brand pushing past its efficient frontier: each extra dollar buys less. Our guide to marginal ROAS shows how to find where that happens.
- About 2% of Meta spend on the wrong objective. Engagement and profile-visit campaigns returned zero sales. Those objectives optimise for likes and visits, not purchases. See the objective section of our Facebook ads guide for Shopify.
A blended number hid most of this. One 3.4x figure averaged a strong Google account with a Meta account that was sliding. That's the problem with blended ROAS on its own.
How do you size the ad leak against the checkout leak?
Put both in money. Then fix the bigger one first.
The ad leak has two parts:
- Spend on campaigns that returned nothing (the wrong objective here).
- Spend past the efficient frontier: the extra budget whose marginal return sits below your break-even ROAS.
The funnel leak is one sum:
(healthy step rate − your step rate) × carts × checkout completion rate × average order value
Example: the numbers here are made up and rounded to show the arithmetic. They don't come from any of the three brands.
A store gets 100,000 sessions a month. 8,000 add to cart. Only 20% of carts reach checkout, so 1,600 start checkout. 60% of those complete: 960 orders at a $60 average, or $57,600 in revenue. It spends $20,000 a month on ads and runs a 40% gross margin, so its break-even ROAS is 2.5x.
Now size both leaks in profit, so you compare like with like:
| Leak | The arithmetic | Profit lost a month |
|---|---|---|
| Wrong-objective campaigns | $400 of spend, zero sales | $400 |
| Spend past the frontier | The last $3,000 returns 1.5x: $4,500 revenue × 40% margin = $1,800 profit on $3,000 spent | $1,200 |
| Ad leak, total | $1,600 | |
| Cart → checkout, 20% → 30% | 800 more checkouts × 60% × $60 = $28,800 revenue × 40% margin | $11,520 |
That last row is only a partial fix, 20% to 30%. Even so, it's worth about seven times the whole ad leak. Closing the full gap to 50% adds 2,400 checkouts and $86,400 in revenue. So: kill the $400 campaigns this afternoon, because that takes five minutes. Leave the budget alone. Put the real work into the cart step.
For brand one, Drew's estimate put the checkout leak at roughly ten times the value of every ad inefficiency combined. Cutting the wrong-objective campaigns was still worth doing. It just wasn't the main job.
What should you not do?
Two moves feel right and make it worse.
Don't cut ad spend to "fix" a checkout leak. You lose the carts you were getting, and the leak stays the same size. Brand two's advice was to leave the ad account alone.
Don't scale ads into a leak either. More spend sends more people into the same broken step. Brand one was raising Meta spend fast while about 4 in 5 carts died before checkout. Fix the step, then scale. If you can't tell whether a dip is real yet, use our signal-or-noise rules before touching anything.
Diagnose it in one pass
Run the checks in this order. Each can fake the one after it.
- Trust the numbers. Analytics orders against Shopify orders. One purchase event per platform. Unassigned sessions under control.
- Read delivery. CPM, CTR, spend and frequency for the same window. Did any of them move enough to explain the drop?
- Walk the funnel. Sessions → add to cart → checkout started → order. Split by device and by channel. Find the first step that changed.
- Size both leaks. Wasted and over-frontier ad spend against the step-rate gap in money.
- Fix the bigger one. Leave the other alone until the first is done.
Example: one pass, week on week. The store and numbers are made up.
- Trust the numbers. Analytics shows 600 orders. Shopify shows 605. Close enough, and there's one purchase event on Meta. Move on.
- Read delivery. CPM rose 5%, from $10.00 to $10.50. CTR held at 1.2%. Spend held at $7,000 a week. Sessions held at about 50,000. A 5% CPM move can't explain orders falling from 1,080 to 600. It's not the ads.
- Walk the funnel. Add-to-cart held at 8%, so 4,000 carts both weeks. Cart to checkout fell from 45% to 25%. Checkout to order held at 60%. That's the first step that moved, and the only one. Split by device: mobile fell from 45% to 20%, desktop barely moved.
- Size it. 4,000 carts × 20 points = 800 lost checkouts. × 60% = 480 lost orders. × $60 = $28,800 in one week.
- Verdict: site, mobile cart. Check what shipped that week: a theme update, a new app, a cart drawer change. Test the cart on a real phone. Don't touch the ad account.
Ads or site? The decision table
Match what moved to where to look.
| What moved | What held | Likely cause | Where to look |
|---|---|---|---|
| Platform ROAS fell | Shopify orders flat | Tracking | Purchase events, attribution window, pixel vs orders |
| CPM rose | CTR, conversion rate | Auction cost | Seasonality, competition, audience size |
| CTR fell, frequency rose | CPM | Creative fatigue | Top ads by spend, refresh the creative |
| Spend rose, ROAS fell | Conversion rate | Past the efficient frontier | Marginal ROAS by campaign, pull back to break-even |
| Cart → checkout fell | CPM, CTR, sessions | Cart friction | Mobile cart, shipping reveal, chat widgets, cart speed |
| Checkout → order fell | Everything before it | Payment or checkout bug | Test order on mobile, payment gateway, discount codes |
| Mobile step rate far below desktop | Desktop | Mobile checkout friction | Real-phone test, session replays |
| Sessions fell on every channel | Spend | Demand | Branded search, direct, organic, seasonality |
| Spend on campaigns with zero sales | Rest of account | Wrong objective | Campaign objective (engagement, traffic, profile visits) |
A prompt to run this in one pass
Paste this into Drew or any AI tool that can read your store and ad data:
Give me a founder view of the last 3 months. Paid ads: spend, ROAS and CPA by channel and by month, plus any campaigns with spend and zero purchases. Website: sessions, add to cart, checkout started and orders, split by device and by channel, with each step's conversion rate. Check tracking first: do analytics orders match Shopify orders, are there duplicate purchase events, and what share of sessions is unassigned? Then tell me whether the bigger leak is in the ads or on the site, and estimate each in money.
Brand one's review came back in one reply. It covered channel ROAS, the zero-sales campaigns, the funnel by device and the three tracking bugs. It also put the checkout leak at the top of the list.
FAQ
Sessions are steady but my conversion rate fell. Is it bad traffic or a broken checkout?
Find the first funnel step that changed. If add-to-cart fell, suspect traffic quality or the product page. If carts held but checkout starts or orders fell, suspect the cart, checkout or payment. If only paid traffic converts worse, suspect targeting. If every channel fell at once, suspect the site. Check analytics against Shopify orders before any of it.
What share of carts should reach checkout?
As a rule of thumb, about half or more in a healthy store. If only 1 in 5 carts reaches checkout, the cart step is your biggest leak. Check it on a real phone before anything else.
Why do people add to cart but not check out on mobile?
Usually friction you can't see on desktop: a cart drawer that won't scroll, a chat bubble over the checkout button, shipping costs revealed late, or a slow redirect to a third-party checkout. In the review above, nearly all traffic was mobile, so mobile checkout was the whole story.
Should I cut ad spend if my checkout is leaking?
No. Cutting spend loses the carts you're getting and leaves the leak the same size. Don't scale into it either. Fix the step, then scale.
How do I know if my Meta purchase tracking is double counting?
Compare Meta-reported purchases against Shopify orders for the same days. Then check Events Manager for more than one purchase event. In one account we reviewed, overlapping purchase events meant the wrong one could overstate revenue by up to 5x.
Why did my Shopify sales drop suddenly this week?
Run the checks in order: tracking, then ad delivery, then the funnel, then demand. In one week of September 2026, one brand's drop was a checkout and payment problem. Another brand's traffic halved across every channel overnight, which was a demand problem. The same question had two different answers. More on the daily version in our ROAS root-cause framework and why did my ROAS drop.