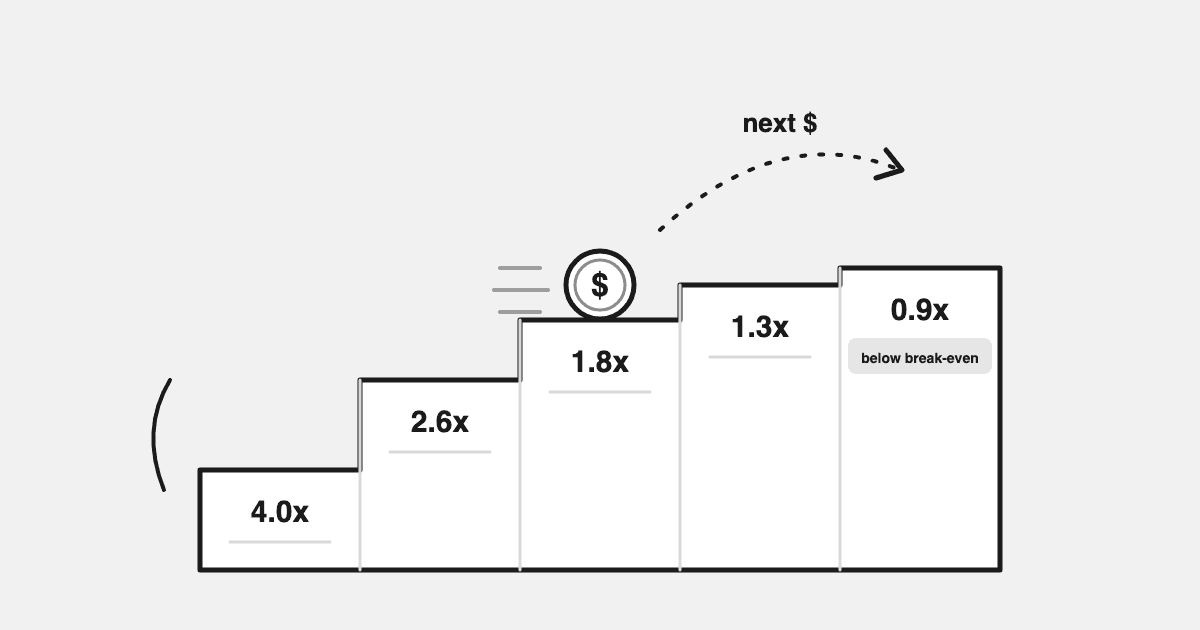
Marginal ROAS is the revenue your last budget step earned divided by the spend of that step, and it is the only ROAS figure that describes the decision in front of you. "You need to be able to survive, I think, a 1.5X ROAS," Sean Frank, CEO of Ridge, said on the Mission.org Up Next in Commerce podcast (quoted as spoken). Most operators hear it as a floor for the account. It is a floor for the next dollar.
Here is the Shopify account that trips over it. Average ROAS holds at 3x for the month. Feels safe. Then the founder looks at the last raise, from $1,000 to $1,500 a day, and the extra $500 brought back revenue at 1.4x. That is the marginal ROAS, and it is already under Frank's line while the account still reads 3x.
This is for founder-operators at $500K–$30M who are mid-scaling-push and can't work out why the last budget increase did worse than the average said it would. The calculator below works marginal ROAS out from four figures you already have.
TL;DR
- Marginal ROAS = extra revenue ÷ extra spend between two spend levels. It tells you what the next dollar earns. Average ROAS tells you what every dollar earned so far, blended together.
- It falls as you raise budget because the cheapest demand gets bought first: auction depth, audience saturation and creative reach all bite on the increment, not the average.
- The floor it has to clear is break-even ROAS = 1 ÷ CM2 margin (revenue after COGS, fulfilment and payment fees, before ads). At 40% CM2 the floor is 2.5x; an account can read 3x on average while the last step earned 1.4x and lost money.
- The move depends on which of the eight budget states the marginal reading puts you in. "Raise 20%" is not one of them.
Average ROAS Lies About the Next Dollar
Average ROAS is every dollar of revenue divided by every dollar of spend, so it carries the history of the account inside it. That history includes the cheapest demand you were ever going to get: brand searches, retargeting to last week's cart abandoners, the first $300 a day that reaches your warmest lookalike. Those dollars earn 6x, 8x, sometimes 12x, and they hold the average up long after the increments stopped paying.
Every raise buys the next block of demand, and the next block is more expensive than the last. The average dilutes slowly. The marginal number shows it immediately. So the operator who watches the average sees a gentle slide from 3.4x to 3.1x and calls it noise, while the operator who watches the marginal number sees the last step earn 1.4x and knows exactly what happened.
Andrew Lolk pulled this apart on one client's Performance Max account. Brand searches inside the campaign ran at 5.5x ROAS; non-brand ran at 2.2x. Blended, the campaign looked like profitable scale. It was mostly cheap branded demand, people who were already buying, booked as prospecting. Same disease, different axis: the average hid what the marginal unit was actually earning.
What Marginal ROAS Is, With the Worked Example
Marginal ROAS = (revenue at the new spend level − revenue at the old spend level) ÷ (new spend − old spend), measured on the same account scope, over windows of the same length, using revenue from Shopify orders rather than a platform's own conversion column.
Walk through an account stepping up from $500 a day.
| Daily spend | Daily revenue (Shopify) | Average ROAS | Marginal ROAS on the last $500 |
|---|---|---|---|
| $500 | $2,000 | 4.0x | 4.0x (first step) |
| $1,000 | $3,400 | 3.4x | ($3,400 − $2,000) ÷ $500 = 2.8x |
| $1,500 | $4,100 | 2.7x | ($4,100 − $3,400) ÷ $500 = 1.4x |
Read the two right-hand columns together. The average never fell below 2.7x. The marginal figure went 4.0x, 2.8x, 1.4x. At a 40% contribution margin before marketing, break-even is 2.5x: the second step cleared it, the third lost money on every one of its $500, and the account "looked fine" the whole time.
Marginal CPA is the same idea for cost per order: extra spend divided by extra orders.
Marginal ROAS vs Break-Even ROAS: The CM1/CM2/CM3 Ladder
Break-even ROAS is the ROAS at which an ad-driven order contributes exactly zero after every variable cost, and it comes from the contribution-margin ladder, not from the ad platform. Marginal ROAS tells you what the next dollar earns; break-even ROAS tells you what it has to earn. You need both, and most dashboards show neither.
The ladder has three rungs, and each rung answers a different question:
| Rung | Formula (per order) | The question it answers |
|---|---|---|
| CM1 | Net revenue − landed COGS | Does the price cover the product? |
| CM2 | CM1 − fulfilment, packaging, 3PL and payment-processing fees | Can you afford to ship and process it? |
| CM3 | CM2 − ad cost | Can you afford to advertise it? |
Net revenue means after discounts and refunds, not Shopify's gross sales line. Landed COGS includes inbound freight and duty. Payment processing is typically 2.5–3% plus a fixed fee per order, and it is the cost most brands leave out.
Break-even ROAS lives at CM2. If an order of $100 net revenue has $40 of landed COGS and $20 of fulfilment and fees, CM2 is $40, or 40%. The most you can spend on ads for that order and still contribute zero is $40, so break-even ROAS = $100 ÷ $40 = 2.5x. In one line: break-even ROAS = 1 ÷ CM2 margin. A 30% CM2 margin needs 3.33x; a 50% margin needs 2.0x.
That is why the 1.4x step lost money: each $500 brought $700 of revenue, worth $280 at CM2, so the step cost $220. CM2 differs by product, so run the per-SKU version of this check before a blended floor hides the SKUs that break even at 4x next to the ones that break even at 1.8x.
Marginal ROAS always falls. The question is which side of 1 ÷ CM2 the last step landed on, and how sure you are. That reading is what the eight budget states turn into a move.
Why Marginal ROAS Falls When You Raise the Budget
Marginal ROAS falls because every budget raise buys demand that is more expensive, more saturated or less suited to the creative than the demand before it. Three mechanisms, and they stack.
Auction depth. At $500 a day the platform bought the impressions it could win cheaply for your creative. The next $500 has to win impressions that cost more, against advertisers who value them more, and the floor keeps rising: Meta's average price per ad was up 12% year over year in Q1 2026. Google Search behaves the same way through impression share: the last 10 points cost more than the first 60.
Audience saturation. More budget on the same targeting reaches the same people more often. Frequency climbs, and the additional person you reach is less likely to buy than the one you reached at half the spend. Past that point you are paying to re-show the ad, not buying new demand.
Creative reach limits. A concept works for the people it works for. Once it has reached them, extra budget buys the people it does not work for, which is why a raise after a fresh winner often holds and the same raise on a 30-day-old concept collapses. Budget scales a creative; it cannot replace one.
Two platform effects muddy the read. A single-step raise of more than about 20% can put a Meta ad set back into learning, so the first days after a raise are noisier than the marginal number suggests. And conversions lag by 24–72 hours, so read the step after a full conversion cycle. Whether a given day's drop is signal or noise is its own question.
If you back off and efficiency heals, you did not break anything; you found the shape of the curve. That is the tell of saturation, and a saturating account needs a new growth path (creative, product, geography) rather than another go at the same slider.
How to Estimate Yours Without an Econometrics Team
A usable marginal ROAS estimate needs two spend levels and two matched windows, not an incrementality test.
- Take two periods from the last six to eight weeks separated by a real budget step (20% or more), each at least one full conversion cycle long, same days of the week, no promotion in either.
- Pull total ad spend for the scope you changed (whole account, or the one campaign you raised).
- Pull Shopify revenue for the same windows, net of refunds and discounts. Not the platform's conversion value: Meta and Google each report against their own attribution window, so their totals will not match the orders that exist.
- Subtract, divide, compare with the average. If you only raised one campaign, platform-reported revenue for that campaign is fine for direction, labelled as such.
Or type the four numbers in here.
Marginal ROAS calculator
Use the same window length for both periods (a week against a week, a fortnight against a fortnight). Any currency.
The calculator works from spend and revenue only; bring the margins you share with Drew to the decision, not to the tool. The budget-state read is published method, from the table below.
A word on precision. This is a two-point estimate of a curve on noisy data, not a lift study. But it describes the decision in front of you rather than the past, and two points beat zero.
The Eight Budget States, and Which Marginal Reading Maps to Which
A budget state is the combination of what the marginal reading looks like, how much evidence sits behind it, and how much headroom the demand and creative have left, and each state has one move. Operators who scale well do not think in percentages. They think in states. "Raise 20% every three days" is not on the list because it ignores all three inputs.
| State | What the marginal reading looks like | The move |
|---|---|---|
| Invest aggressively | Marginal close to average, well above break-even, enough conversions to trust it, stock and creative to spend into | Raise in measured steps; re-read after each conversion cycle |
| Scale cautiously | Above break-even but sliding, or thin evidence (few conversions, short window, recent edit) | Smaller steps, longer windows, fix the evidence first |
| Maintain | Average fine, marginal unclear or flat around break-even | Hold. Work on creative, offer or conversion rate instead |
| Constrain | Marginal a fraction of average; current spend sits at its limit | Cap the budget; stop testing the ceiling with money |
| Harvest | Finite demand mostly captured (brand search, retargeting); more budget buys re-shows | Fund it to capture existing demand, no further |
| Explore | No marginal reading yet; the spend is buying information | Fixed test budget, fixed window, judge on learning |
| Reduce | Below break-even on a clean read; cause is saturation or a fading creative, not a tracking break | Step back to the last level that paid; move the difference to the best marginal read |
| Pause | Negative expected value, or a rule you set is broken (stock, cash, margin floor) | Stop, with a written restart condition |
Notice what the table is missing: a ranking of campaigns by ROAS. Moving money by sorting a column is how brands over-feed brand search and starve the concept that would have carried Q4. Platform ROAS is one input to one of the three things a state weighs (expected contribution, confidence, headroom). That is all it is.
Where Should the Next $1,000 Go?
The next unit of budget goes to the highest marginal contribution you can trust, until its marginal reading falls to meet the others. With readings for two or three places (the core Meta campaign, the Google Shopping set, the concept in testing), the allocation mostly answers itself, and Meta versus Google is the same question at channel scale.
The common 70/20/10 split (70% proven, 20% scaling candidates, 10% tests) is a fair starting shape for a fixed budget; the marginal reading tells you which campaign belongs in which bucket this week. The cut-or-feed method covers the weekly routine; this table is the marginal layer on top of it.
| Marginal reading on the last step | Budget state | What to do with the next $1,000 |
|---|---|---|
| Within ~20% of average and above 1 ÷ CM2 | Invest aggressively | Add it here, in 10–20% steps every 3–4 days, re-read after each conversion cycle |
| Above 1 ÷ CM2 but 30–50% below average | Scale cautiously | Add half; hold the rest until the next clean read |
| Around 1 ÷ CM2, or under 30 conversions in the window | Maintain | Nothing. Put the $1,000 into creative or the offer instead |
| Well above average on a small base (brand, retargeting) | Harvest | Only what the demand can absorb; the rest goes elsewhere |
| No reading yet (new concept, new market) | Explore | A fixed test budget with a fixed window; judge on learning |
| Below 1 ÷ CM2 on a clean read | Reduce | Take money out until the marginal reading recovers; send the difference to the best trusted marginal read |
Keep every live campaign above a floor it can learn on: around $300–500 a month per campaign is the practical minimum before its readings mean anything. And compare channels on their marginal reads, measured on Shopify orders, never on their average platform ROAS: Google Search at 6x average can be fully harvested with a marginal reading near 1x while Meta at 2.4x still has room.
Marginal vs Blended vs Platform ROAS: Which Number Answers Which Question
Marginal, blended and platform ROAS are three ratios with three jobs, and using one for another's job is where scaling decisions go wrong.
- Blended ROAS (MER): total Shopify revenue ÷ total ad spend. Is the whole business still efficient? Credits every channel with all revenue, so it cannot allocate. Here is what blended ROAS tells you and what it can't.
- Marginal ROAS: what the next dollar earns, in one scope. The scaling number. This piece.
- Platform ROAS: direction inside one channel, reported against that platform's own attribution window, never additive across channels.
Incremental ROAS, the lift-test sense of "what would not have happened without the ads", is a fourth number with its own price tag: a holdout, a geo test or a model, usually quarterly rather than weekly.
How Drew uses this
- Ask Drew where your next ad dollar should go. Its budget recommendations weigh the margins you share with it, your inventory and your repeat behaviour, not platform ROAS alone, with the reasoning: what to scale, reduce, pause or leave alone this week, and why.
- Drew reads yesterday's Shopify orders and Meta and Google spend every day, so the marginal read is on realised revenue. Daily, not intraday.
- The eight states are method, not a stamp. Drew brings the numbers and the argument; the raise is still your call.
To see the shape of this on your own account, pricing is published and flat and the free plan doesn't need a card.
Key Takeaway
Marginal ROAS is extra revenue divided by extra spend between two budget levels, and it is the only ROAS figure that describes the decision you are about to make. It falls as you scale, through auction depth, audience saturation and creative reach, and it can sit below break-even while the average still reads 3x. Estimate it from two matched windows and Shopify revenue, read it against 1 ÷ CM2 margin, and let the eight budget states decide the move. An account that "holds 3x" while the next dollar earns 1.4x is already under Sean Frank's 1.5x survival line. The average will be the last number to tell you.
FAQ
What is marginal ROAS?
Marginal ROAS is the revenue earned by the last increment of ad spend, divided by that increment: (revenue after − revenue before) ÷ (spend after − spend before), over matched windows. An account stepping from $1,000 to $1,500 a day that adds $700 of revenue has a marginal ROAS of 1.4x even if its average still reads 2.7x. Average ROAS describes every dollar spent so far; marginal ROAS describes the next one, the only dollar a budget decision can affect.
How do I calculate marginal ROAS?
Take two periods separated by a real budget step of 20% or more, each at least one full conversion cycle long, on the same days of the week and without a promotion. Subtract the earlier period's Shopify revenue from the later one's, subtract the earlier spend from the later spend, and divide. Use Shopify revenue net of refunds rather than platform-reported conversion value, because Meta and Google each report the same orders against their own attribution windows.
Why does my ROAS drop every time I raise the budget?
Because the platform bought your cheapest demand first. Each raise buys impressions that cost more (Meta's average price per ad rose 12% year over year in Q1 2026), reaches people less likely to buy, and stretches a creative past the audience it works for. If efficiency recovers when you back off, you have found the saturation point of the current setup, and the next level of spend needs new creative, a new product or a new market rather than more budget on the same thing.
Is marginal ROAS the same as incremental ROAS?
No. Marginal ROAS is an observed estimate of what the last spend step earned, taken from two points on your own account and readable weekly. Incremental ROAS is a causal claim, what would not have happened without the ads, and needs a holdout, a geo test or a model, which is why most brands run it quarterly at most. Marginal is the cheap scaling read; incremental is the expensive truth check.
What marginal ROAS should I stop scaling at?
At your break-even ROAS, which is 1 ÷ CM2 margin (margin after COGS, fulfilment and payment fees, before ads). A brand at 40% CM2 breaks even at 2.5x; at 30% it needs 3.33x; at 50% it needs 2.0x. Stop raising when the marginal reading approaches that floor, unless you are deliberately buying customers below first-order break-even because their repeat behaviour, measured at product or cohort level, pays it back.
My ROAS drops every time I raise the budget. How do I scale without breaking the campaign?
Raise in 10–20% steps rather than doubling, wait a full conversion cycle (usually 3–4 days on Meta) before the next step, read each step against Shopify revenue, and stop where marginal ROAS meets 1 ÷ CM2. Then scale sideways instead of up: a new creative concept, a product with better margin and stock, a new geography or a stronger offer. The eight budget states map each reading to its move.
Written by Sumit Bansal, co-founder of Datadrew. Published 3 September 2026, revised 7 September 2026. Cost and quote sources are linked inline. Datadrew deals in realised numbers with Shopify orders as the source of truth; we don't adjudicate which channel deserves credit for a sale.