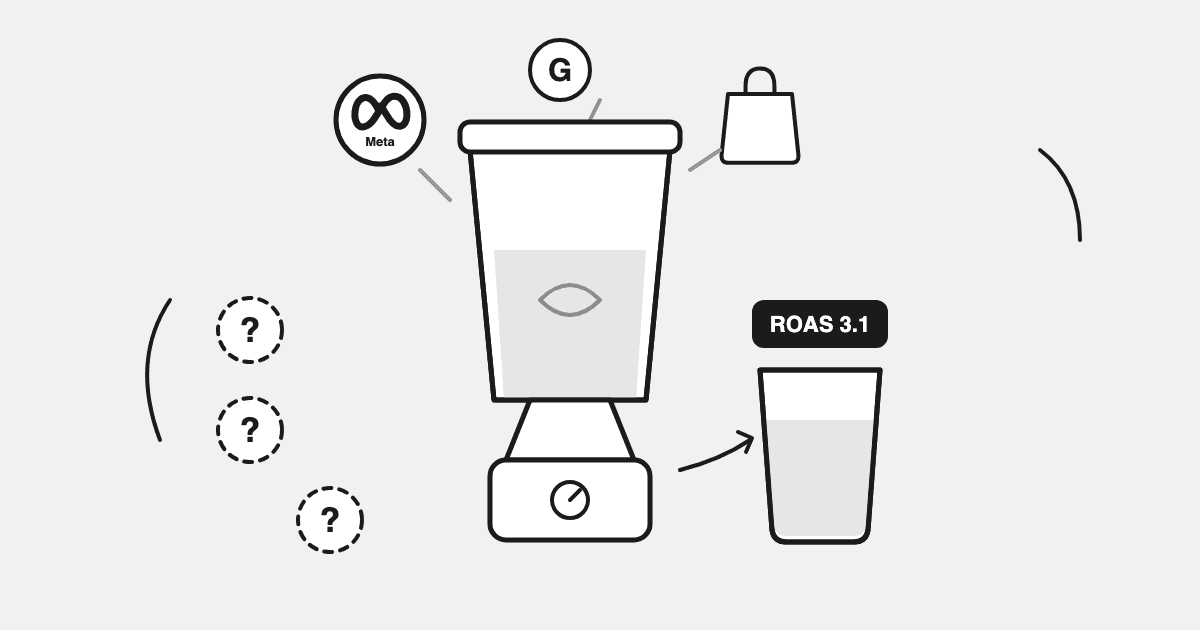
You moved to blended ROAS because platform ROAS stopped making sense. Meta claimed one number, Google claimed another, and adding them together produced more revenue than your bank account had ever seen. Blended ROAS fixed that. One number, drawn from real orders, that nobody can inflate.
Then someone asked whether a 3.4x was good, and you realised you had no idea.
This is for Shopify founder-operators and growth leads at $500K–$30M who already know the formula and want the part nobody writes: what blended ROAS can and cannot see, and what to check alongside it before you scale on it. If you need the mechanics of pulling the number across Meta, Google and Shopify, we wrote that separately, how to calculate blended ROAS across Meta, Google and Shopify. This piece is about what the number means once you have it.
Key Takeaways
- Blended ROAS (MER) is the most honest top-level efficiency number, but it is a thermometer, not a diagnosis.
- It cannot tell you which spend is working, whether growth came from ads or retention, or what to do next.
- Pair it with new-vs-returning splits, product-level profit context, and cohort LTV before making budget calls.
Blended ROAS in one line — and the definitional mess you'll hit immediately
Blended ROAS = total store revenue ÷ total ad spend. Same period, every channel, no attribution involved.
Then you search the term and find four incompatible definitions, three of which are called MER. This isn't pedantry, the confusion changes what number you target.
| Where you'll see it | The formula they use | What that makes it | So "3.0" means |
|---|---|---|---|
| Most DTC operators — Common Thread Collective, Shopify, Daasity, Foxwell | Total revenue ÷ total ad spend. MER and blended ROAS treated as the same thing | An efficiency multiple. Higher is better | $3 of revenue per $1 of spend |
| The scope camp — Polar, Enalitica, Superscale | Blended ROAS uses paid media only; MER widens the denominator to include agency fees, tools and creators | Same operation, wider denominator for MER. MER is always ≤ blended ROAS | Depends which one you're reading |
| Triple Whale's docs | MER = ad spend ÷ revenue — a ratio in their docs, a percentage in their benchmark posts | A cost ratio. Lower is better | "MER 41%" is 2.44x in everyone else's units |
| Some 2026 vendor blogs | Blended ROAS = paid-attributed revenue ÷ paid spend | Not a blend at all | Nothing useful — see below |
Two things follow.
First, watch the reciprocal. If your tool reports MER as a percentage, it's using spend ÷ revenue. A coach telling you to target "MER above 3" and a dashboard showing "MER 41%" are describing reciprocal quantities under one name. To convert: 1 ÷ 0.41 = 2.44x. Check which convention your tool uses before you set a target against it.
Second, that fourth definition defeats the point. If you could reliably separate "paid revenue" from total store revenue, you'd have already solved attribution and wouldn't need a blended metric. The whole value of the blend is that it uses the one number you can verify, total orders in Shopify, precisely because you can't apportion revenue to channels. A "blended" ratio built on attributed revenue is just platform ROAS with extra steps.
Everything below uses the operator convention: total revenue ÷ total ad spend, higher is better.
What blended ROAS tells you that platform ROAS can't
Platform-reported conversions are not additive. Meta reports the conversions it observed inside its attribution window. Google reports the ones it observed inside its own. The same order can legitimately appear in both, neither platform is wrong, they're each answering a question about their own delivery. But the sum of those reports can exceed the number of orders that actually exist, because those numbers were never designed to be added together.
DTC growth operator Curtis Howland puts the arithmetic plainly on his newsletter: "Meta says they drove 500 conversions. Google says they drove 400. TikTok claims 150. That's 1,050 'attributed' conversions for a brand that actually had 600 orders."
Blended ROAS sidesteps that entirely. It uses a number that can only be counted once, the revenue that landed in Shopify, against a number that can only be spent once:
- It cannot be double-counted, because there's one numerator.
- It moves when your business moves, not when a tracking window changes.
- It's the same number your accountant would recognise.
So blended ROAS is an honest efficiency ratio for total marketing. That's it. It is not a profit metric, not a channel metric and not an acquisition metric, and the next three sections are the three ways operators get hurt assuming otherwise.
What blended ROAS cannot tell you
1. Whether you made money — that's contribution margin, not revenue
Blended ROAS counts revenue. Your business keeps contribution margin. The gap between them is COGS, shipping and fulfilment, payment processing and returns handling, and it decides your breakeven entirely.
Breakeven blended ROAS = 1 ÷ contribution margin before marketing.
| Contribution margin before marketing | Breakeven blended ROAS |
|---|---|
| 30% | 3.33x |
| 40% | 2.50x |
| 45% | 2.22x |
| 50% | 2.00x |
| 60% | 1.67x |
| 70% | 1.43x |
Read that twice, because it's why "is 3x good" has no answer. At 60% margin a 3x blend is comfortable. At 30% margin the identical 3x is already under water, breakeven is 3.33x, and every point of discount you run digs the hole deeper.
This is also why a strong platform ROAS can hide a per-order loss. A $30 t-shirt at 3.5x ROAS with 25% returns and $10 of shipping loses money on every order once COGS is in. The ad account will never tell you.
What Drew does with this: the Morning Brief carries the blend and the contribution margin behind it in the same message, revenue after COGS, shipping, fees, discounts and refunds, reconciled to Shopify orders overnight. So the breakeven line above isn't a calculation you run quarterly; it's the number sitting next to the ratio every morning.
2. Who actually bought — the new-vs-returning split hiding in the numerator
This is the one that costs real money, because it's invisible in a metric that's improving.
About 60% of revenue at established DTC brands with a working retention programme comes from returning customers; across all of Shopify the figure is nearer 44%, dragged down by younger and low-retention stores (Eightx benchmark analysis, June 2026). All of that revenue sits in your blended ROAS numerator. Very little of it was caused by this month's ad spend.
So the blend can look strong while your acquisition engine quietly stops working. Here's a month that shows it.
| Line | Value |
|---|---|
| Shopify net revenue (after discounts and refunds) | $200,000 |
| Total ad spend, Meta + Google | $50,000 |
| Blended ROAS | 4.0x |
| New-customer revenue (40%) | $80,000 |
| Returning-customer revenue (60%) | $120,000 |
| Acquisition ROAS (new-customer revenue ÷ ad spend) | 1.6x |
| Contribution margin before marketing (COGS 42%, shipping 10%, fees 3%, returns handling 5%) | 40% |
| Breakeven blended ROAS (1 ÷ 0.40) | 2.5x |
| Contribution on total revenue | $80,000 |
| Contribution after ad spend | +$30,000 |
| Contribution on new-customer revenue only | $32,000 |
| New-customer contribution after ad spend | −$18,000 |
This charges all $50,000 to acquisition. If you run retargeting, split the spend first, the direction holds, the magnitude changes.
Both readings are true. The business made $30,000 of contribution this month. And the acquisition engine ran 1.6x against a 2.5x breakeven, spending $18,000 more than the new customers it bought were worth on their first order.
That's not automatically bad. Paying above first-order value is correct if those customers come back, which is a 90-day cohort LTV question, not a ROAS question. What's bad is not knowing which of the two months you're in, then scaling because the blend looked healthy.
Curtis Howland describes the real-world version: a brand showing 4.2x on Meta that looked excellent until he added the rest of the picture, a 35% new-customer ratio, 48% COGS and 8% platform fees. On his account, that 4.2x month was a $15,000 loss.
What Drew does with this: the new-versus-returning split arrives attached to the number, not as a report you go and build. Drew reconciles Shopify orders against Meta and Google spend overnight, so the morning answer already separates what new customers bought from what returning customers bought, and RFM segments push into Klaviyo as flow-ready audiences rather than screenshots.
3. Which channel to cut — and which products are carrying the margin
Blended ROAS is one number for all of your spend. It cannot allocate. If your blend slips from 3.4x to 2.9x it will not tell you whether Meta prospecting broke, Google brand search got more expensive, or you simply ran a promo.
Averages hide inside averages, too. A Performance Max campaign that reads as profitable scale can be mostly cheap branded demand that would have converted anyway, the blend, and the campaign's own ROAS, both look fine right up until you split brand from non-brand.
Our answer is a different question. We deal in realized profit, with Shopify orders as the source of truth, each channel's own reporting and GA4 source/medium sit next to that revenue, and the cut/feed decision gets graded on contribution margin at the shop and product level rather than on credit. You don't need to adjudicate credit to see whether total marketing is carrying margin, and which products inside it are.
That product view is where the blend hides the most. In a Datadrew analysis of a 1,301-product store in July 2026, a handful of products repurchased at 3–6x the store average while reaching only dozens of new buyers each. Nothing in that store's blended ROAS moved when those products were under-fed, the ratio was steady while the cheapest growth lever in the catalogue sat idle.
What "good" looks like — and why the rule of thumb is probably wrong for you
The internet is confident about this. Foxwell Digital said 2–4x back in 2021. Shopify's own blog says that for established companies, a MER between 3 and 5 signals sustainable spending. Several vendor glossaries land on 3.0–5.0.
Now put a measured number next to it. One published 2025 dataset, Triple Whale, reporting across its customer base, puts the median MER at 41% in the spend ÷ revenue convention. Converted: 2.44x.
The most-repeated benchmark in DTC sits above that median. Almost nobody has noticed, because the heuristic and the measurement are published in reciprocal units and nobody converts them. Two caveats keep it honest: the sample size behind the 41% isn't published, and Shopify's 3–5 range is scoped to established brands while the median isn't scoped at all. So it isn't a like-for-like comparison, but the gap is large enough to be worth knowing about.
Two things to take from it:
- A 2.44x blend is not a failing grade. If you've been treating 3x as a floor, you may have been treating a median as a minimum.
- The rule of thumb still isn't your number. Your breakeven is 1 ÷ your contribution margin. Everything above it is contribution; everything below it is a subsidy you'd better be earning back in repeat purchases.
One more input: Meta's average price per ad rose 12% year over year in Q1 2026, on top of 9% across full-year 2025. Your target should be a function of your margin, not a number you defend against a rising floor.
How to read blended ROAS without rebuilding the spreadsheet
The reason most brands check this monthly rather than weekly isn't discipline, it's that assembling it by hand takes an hour and breaks constantly. Shopify's timezone doesn't match your ad accounts. Refunds land days after the order. Gross sales, net sales and total-including-shipping are three different numbers and only one belongs in the numerator.
That assembly is the job Drew does overnight, across Shopify, Meta, Google, GA4 and Klaviyo, with Shopify orders as the source of truth. Then you can ask follow-ups in plain English, "what was our new-customer contribution margin last week versus the four weeks before?", and get the answer with the arithmetic shown, in Slack, in the app, or inside Claude.
Checks run daily, not continuously. We catch the weekend problem on Monday morning, and we say so.
To see the shape of this on your own numbers, the free store health check runs on your real data, and the free plan doesn't need a card. Pricing is published and flat from $149/month.
Key takeaway
Blended ROAS = total revenue ÷ total ad spend. It's the most honest efficiency ratio available to a Shopify brand, because it uses a number that can only be counted once. But it's a revenue ratio, not a profit one. It can't tell you whether you made money, that's 1 ÷ contribution margin. It can't tell you who bought, that's the new-versus-returning split, and returning customers can hold the blend up while acquisition falls apart. And it can't tell you which channel to cut, or which products are carrying the margin. Track it alongside your breakeven and your acquisition ROAS and it's a good instrument. Track it alone and it's the number that read 4.2x on a month that lost $15,000.
Frequently asked questions
Is blended ROAS the same as MER?
For most DTC operators, yes, both are total revenue ÷ total ad spend. Two exceptions matter. Some sources reserve MER for a wider denominator including agency fees, tools and creator payments, which makes MER slightly lower than blended ROAS. And Triple Whale's documentation defines MER as ad spend ÷ revenue, a cost ratio. Check your tool's convention before setting a target against it.
My dashboard shows MER as a percentage. Is that the same number?
No, it's the reciprocal. A MER of 40% means you spent $0.40 on ads for every $1 of revenue, which is a 2.5x blended ROAS. Convert with 1 ÷ the percentage. Mixing the two conventions is the most common way brands end up targeting the wrong number.
My blended ROAS is 3x. Am I profitable?
Only if your contribution margin before marketing is above 33%. Breakeven blended ROAS is 1 ÷ contribution margin, so 3x clears a 40% margin comfortably and fails a 30% one. Work out your own margin after COGS, shipping and fulfilment, payment processing and returns handling before judging any ROAS figure.
Why did my blended ROAS go up while my bank balance went down?
Usually one of three things. Returning-customer revenue grew and carried the ratio while new-customer acquisition got more expensive. Or you discounted, which lifts revenue and cuts margin at once. Or refunds from an earlier period landed in this one. Splitting revenue into new versus returning is the fastest way to tell which.
Can blended ROAS tell me which channel to cut?
No. It's one ratio across all your spend and it has no allocation logic in it. Use it to judge whether total marketing is efficient, then make the cut/feed decision on contribution margin at the shop and product level, with each platform's own reporting and GA4 source/medium visible alongside your realized Shopify revenue.
Is a 2x blended ROAS good?
It's above breakeven for any brand with a contribution margin over 50%, and below breakeven for one at 40%. Against the market, a 2.44x blend was the median in one published 2025 dataset, so 2x sits a little under typical but nowhere near alarming on healthy margins. Your margin decides, not the benchmark.
FAQ
Is blended ROAS the same as MER?
Yes, both mean total revenue divided by total marketing spend. The term MER (Marketing Efficiency Ratio) is more common among agencies; blended ROAS among brands.
What should I use alongside blended ROAS?
Split new-customer from returning-customer revenue, watch contribution margin rather than revenue where you can, and read cohort curves for the repeat behavior blended numbers hide.
How do I calculate blended ROAS across Meta, Google and Shopify?
Full walkthrough here: how to calculate blended ROAS across Meta, Google & Shopify, or connect the Datadrew MCP and ask Claude directly.
Related reading: Why Is My ROAS Down Today? A Daily Root-Cause Framework.