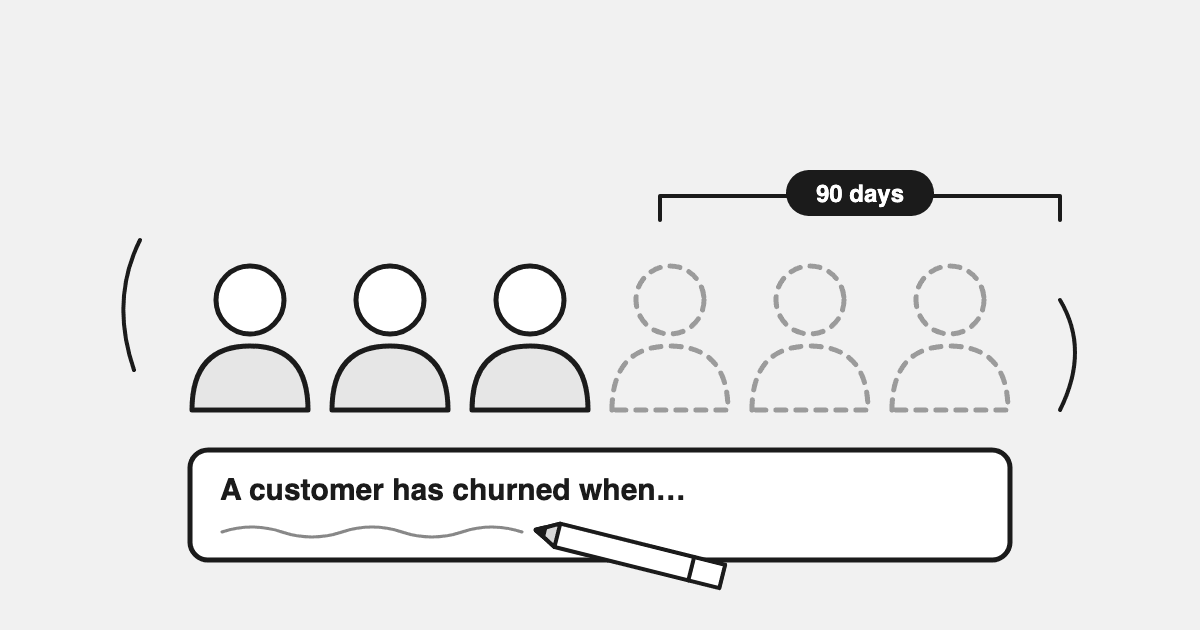
One Shopify brand asked its AI agent a simple question: what's the average lifetime value of customers who churned in July and August? It redefined "churned" three times. It got three answers. The customer counts were roughly 10x apart at each step, and the average LTV more than tripled from the widest definition to the narrowest. All three answers were correct. The fix is to write your churn definition as one sentence before you calculate anything: who counts, how long without an order, measured from when, and compared to what.
The numbers below come from real sessions with Drew, DataDrew's AI agent for Shopify. They are rounded, and the brands are not named. The method works for any non-subscription store.
TL;DR
- Ecommerce churn is silent. Nobody cancels. A customer just stops ordering. So "churned" only exists once you define it.
- One brand, three definitions, three answers. Customer counts ran from a few thousand to hundreds of thousands. Average LTV moved about 3.5x.
- Write it as one sentence: "A customer is churned if they [who] have placed no order in [window] since [anchor date]." Fill all four blanks before you run a number.
- Pick the window from your own data: roughly 2x the median gap between first and second order. Common results are 90, 180 or 365 days.
- Recent lapsers are worth the most. At the same brand, customers who lapsed recently had about 2.5x the historic LTV of those who lapsed years ago. Win back by recency.
- The blended number is the least useful one. Another brand's all-time LTV looked fine. Split by first-order year, it had roughly halved in two years.
What is customer churn in ecommerce?
Customer churn in ecommerce is the share of customers who stop buying from you over a set period. In a subscription business, churn is a cancel event. In a normal Shopify store, there is no event. A customer places an order, then never comes back, and nothing in your data says "churned."
That's why ecommerce churn is a definition, not a measurement. You decide when silence becomes churn. Change the decision and the number changes, sometimes by 10x.
Two kinds matter most:
- Customer churn: how many customers you lost, whatever they were worth.
- Revenue churn: how much revenue those customers used to bring in.
Subscription brands also split voluntary churn (the customer quit) from involuntary churn (the card failed). For non-subscription stores, almost all churn is voluntary and silent.
What is the formula for ecommerce churn rate?
The textbook formula comes from subscriptions:
Churn rate = customers lost during the period ÷ customers at the start of the period × 100
Start the quarter with 1,000 customers, lose 50, and churn is 5%. New customers don't count.
For a store without subscriptions, "customers lost" has no clean meaning. Use the cohort version instead:
Ecommerce churn rate = customers in a cohort who did not order again within your window ÷ customers in that cohort × 100
Revenue churn uses the same cohort: revenue those churned customers generated in the prior period ÷ total revenue from the cohort in that period × 100.
Example (illustrative, round numbers): 2,000 customers ordered in January. The window is 180 days.
- Cohort size: 2,000.
- By the end of July, 700 had ordered again. 1,300 had not.
- Churn rate = 1,300 ÷ 2,000 × 100 = 65%. Retention is the other 35%.
- The cohort spent $100,000 in January. The 1,300 churned customers spent $52,000 of it.
- Revenue churn = 52,000 ÷ 100,000 × 100 = 52%.
Revenue churn came in below customer churn, so the customers who stayed were the bigger spenders. That's a good sign. If revenue churn is higher than customer churn, your best customers are the ones leaving. Look at that before anything else.
For context, published benchmarks put annual churn for non-subscription ecommerce at around 70-77%, meaning roughly three in four customers never order again within a year (LoyaltyLion, Shopify). Treat that as a sanity check, not a target. Your category's reorder cycle matters more.
Why did one brand get three different churn answers?
Here's the session that inspired this post. A Shopify brand asked Drew for the average LTV of customers who churned in July and August. Then it changed what "churned" meant, twice.
| Definition (paraphrased) | Customers counted | Average historic LTV (index) |
|---|---|---|
| A. Last order before a cut-off date, then six months of silence | hundreds of thousands | 1.0x |
| B. Bought last summer, no order in a later two-month window | tens of thousands | about 2.5x |
| C. Bought last summer, last-ever order fell in a later two-month window | a few thousand | about 3.5x |
Each step changed the count by roughly 10x. The LTV moved the other way. Definition A swept in every one-time buyer from years back, which dragged the average down. Definition C kept only customers who had bought last summer, came back at least once, and then went quiet. Those are loyal customers, which pushed the average up.
On the third redefinition, Drew stopped and asked a clarifying question before running anything. That's the right move. When the question has three valid readings, a confident single answer is the wrong answer.
The lesson isn't "definition C is correct." Each answers a different business question:
- A tells you how big your dormant list is. That's a list-hygiene and reactivation question.
- B tells you which recent buyers skipped a buying window. That's an early-warning question, and some of them will come back on their own.
- C tells you whether customers who kept coming back have now stopped. That's a retention alarm and your best win-back list.
Pick the question first. The definition follows.
How do you define churn in one sentence?
Fill in four blanks:
A customer is churned if they [WHO] have placed no order in the last [WINDOW] as of [ANCHOR DATE], and we compare them to [BASELINE].
- WHO: all buyers, repeat buyers only, a first-order cohort, or a segment such as a channel or product line.
- WINDOW: how long without an order counts as gone. 90, 180 or 365 days are common.
- ANCHOR DATE: the date you measure from. "Today" and "end of last quarter" give different answers.
- BASELINE: the group you divide by. Customers active in the prior period, or everyone in the cohort.
Three filled-in examples:
- "A customer is churned if they bought at least twice and have placed no order in the last 180 days as of 30 September, compared to all repeat buyers active a year earlier."
- "A customer is churned if they first ordered in Q1 and have placed no order in the last 120 days as of today, compared to the full Q1 cohort."
- "A customer is churned if they bought anything and have placed no order in the last 365 days as of 1 January, compared to everyone who bought in the prior year."
Write the sentence at the top of the report. Anyone who reads the number can see what it means. And when someone quotes a different churn rate, you can compare sentences before you compare numbers.
How long should your churn window be?
Use your own reorder data, not a default:
- Take every customer with at least two orders.
- Measure the days between their first and second order.
- Find the median.
- Set your churn window at about 2x that median.
If the median gap is 60 days, a 120-day window is sensible. Past twice the normal gap, the odds of a return drop fast.
Example (illustrative, round numbers): A coffee store has 4,000 customers with two or more orders.
- Median days between first and second order: 45.
- Window = 2 × 45 = 90 days.
- On 1 October, 1,800 of the 4,000 have no order since 3 July.
- Churn among repeat buyers = 1,800 ÷ 4,000 × 100 = 45%.
With a default 365-day window, only 600 of them would count as churned, or 15%. The report looks calmer, and the win-back flow fires nine months after the customer switched brands. Use the 90-day window and start the win-back at day 90.
Rough starting points if you have little history:
| Reorder pattern | Typical window |
|---|---|
| Consumables (food, coffee, household refills) | 60-120 days |
| Apparel and accessories | 180 days |
| Home goods and durables | 365 days or more |
Check the result against your repeat purchase rate. If you want to see what normal looks like month by month, our repeat purchase rate benchmarks break it down from month 1 to month 12.
One more check from the same brand: about 60% of customers who were active a year earlier had been silent for 6+ months. With a 180-day window, that's churn. With a 365-day window, most of them are still "active." Same customers, very different story.
Which churned customers are worth winning back?
Once the brand settled on a definition, it asked for a breakdown by year of last order. The pattern was clear: the more recently a customer lapsed, the higher their historic LTV.
Customers whose last order was before 2023 had the lowest average LTV. Customers who lapsed in early 2026 had roughly 2.5x as much. Every year in between sat on the same upward slope.
Why? Recent lapsers were often loyal customers who bought for years, then drifted. Old lapsers were mostly one-time buyers who never came back. The two groups need different plays:
- Lapsed in the last 6 months: personal win-back. Remind them what they bought, restock prompts, a real reason to return. Discount only if the first touch fails.
- Lapsed 6-18 months ago: lighter campaigns, new products, what changed since they left.
- Lapsed 2+ years ago: mostly list hygiene. Suppress or sunset them so they stop hurting deliverability and inflating your "churn."
Example (illustrative, round numbers): A store has 10,000 churned customers. It splits them by last order and assumes a win-back rate for each group. The rates are guesses to test, not benchmarks.
| Last order | Customers | Average historic LTV | Assumed win-back rate | Customers won back |
|---|---|---|---|---|
| 0-6 months ago | 2,000 | $300 | 10% | 200 |
| 6-18 months ago | 3,000 | $180 | 4% | 120 |
| Over 18 months ago | 5,000 | $100 | 1% | 50 |
The newest 20% of the list brings back 200 customers. The other 80% brings back 170 combined. So the store writes its best win-back sequence for the 0-6 month group first, sends a lighter campaign to the middle group, and sunsets most of the oldest group.
A recency segment in Klaviyo does most of this work. Our RFM segmentation guide shows how to build it.
Why does your blended LTV hide churn?
Another brand asked Drew a simpler question: "What's my CLV?" The all-time number looked healthy.
Then Drew split it by the year of each customer's first order. Customers acquired two years earlier had an LTV roughly twice as high as customers acquired last year. Their repeat rate had fallen from about 1 in 4 to about 1 in 8. Average order value slipped too.
The blended figure mixed old, loyal cohorts with new, weaker ones. The old cohorts propped up the average while new customers churned faster every year. Nothing in the headline number showed it.
Example (illustrative, round numbers): Compare 12-month LTV so both cohorts have the same time to buy.
| Cohort | Customers | 12-month LTV |
|---|---|---|
| Acquired two years ago | 6,000 | $200 |
| Acquired last year | 4,000 | $100 |
- Blended LTV = (6,000 × $200 + 4,000 × $100) ÷ 10,000.
- That's ($1,200,000 + $400,000) ÷ 10,000 = $160.
- $160 is 20% below the older cohort. The newest cohort is 50% below.
If this store sets its acquisition cost ceiling from the blended $160, it will overspend to acquire new customers. The number to plan against is $100, the newest cohort's LTV.
This is the same lesson as the three definitions. The blended number is the least useful one. Split churn and LTV by:
- First-order cohort (month or year acquired)
- Lapse recency (when they last ordered)
- Order count (one-time vs repeat)
Our cohort analysis guide covers how to read these curves, and the customer LTV guide covers LTV by cohort, product and channel.
How do you calculate customer churn in Shopify, step by step?
- Write your one sentence. All four blanks filled.
- Export customers with order history. Shopify's customer export gives total orders and spend. You'll need order dates too, so export orders as well and join them by customer.
- Find each customer's last order date and order count.
- Apply your WHO filter. For example, keep customers with 2+ orders.
- Apply your window from the anchor date. Flag anyone whose last order is older than the window.
- Divide by your baseline. That's your churn rate.
- Split the churned group by year of last order and by first-order cohort. Compare average LTV across the splits.
In a spreadsheet, steps 2-5 take an afternoon for a mid-size store and break on large ones. Or ask an agent that reads your Shopify data directly. Drew runs the same logic in one prompt, and asks you to clarify when the definition is vague.
What prompts can you paste into Drew?
Copy these into Drew and swap in your own dates and window:
- "Define a churned customer as anyone with 2+ orders and no order in the last 180 days. What share of customers active a year ago are churned today?"
- "What's the average historic LTV of customers whose last order was before [date]? Break it down by year of last order."
- "Split my customer LTV and repeat rate by year of first order. Is it rising or falling?"
- "What's the median number of days between a customer's first and second order? Suggest a churn window."
- "List customers with 3+ orders whose last order was 120-240 days ago, sorted by total spend."
The first prompt includes the full definition. If you ask "what's my churn rate?" with no definition, a good agent should ask you which one you mean. If it doesn't, be suspicious of the answer.
What mistakes make churn numbers wrong?
- Using the subscription formula on a non-subscription store. "Customers at start of period" has no clean meaning without a cancel event.
- Leaving the window unstated. A 90-day and a 365-day churn rate can differ by tens of points.
- Mixing one-time and repeat buyers. One-time buyers swamp the count and pull average LTV down.
- Reading only the blended number. It hides cohorts that are getting worse.
- Comparing your churn to someone else's without their sentence. You're probably comparing different definitions.
- Treating all churned customers the same. Recent lapsers are worth more and easier to win back.
Churn is a retention metric, and retention drives how much you can afford to spend on acquisition. If your newest cohorts churn faster, fix retention before you scale ads.
FAQ
What is a good churn rate for ecommerce?
For non-subscription stores, annual churn of around 70-77% is typical, so a lower number is better than average. Compare within your category and against your own past cohorts, using the same definition each time.
How many days without an order means a customer has churned?
There's no universal number. Use about 2x the median gap between a customer's first and second order. That usually lands between 90 and 365 days depending on how often your product gets reordered.
What's the difference between churn rate and retention rate?
They're two sides of one number for a single cohort. If 30% of a cohort orders again within your window, retention is 30% and churn is 70%, as long as both use the same definition.
How do I calculate churn for a store without subscriptions?
Use cohorts. Take the customers who ordered in a period, set a window, and count how many didn't order again inside it. Divide by the cohort size.
What is the LTV of a churned customer?
It's the revenue they generated before they stopped ordering. It varies hugely by definition. At one brand, the narrowest definition gave an average about 3.5x the widest. Churned customers who lapsed recently usually have the highest LTV and are the best win-back targets.
Should I include one-time buyers in churn?
Include them if you want to size your dormant list. Exclude them if you want to know whether loyal customers are leaving. Say which one you did in your definition sentence.