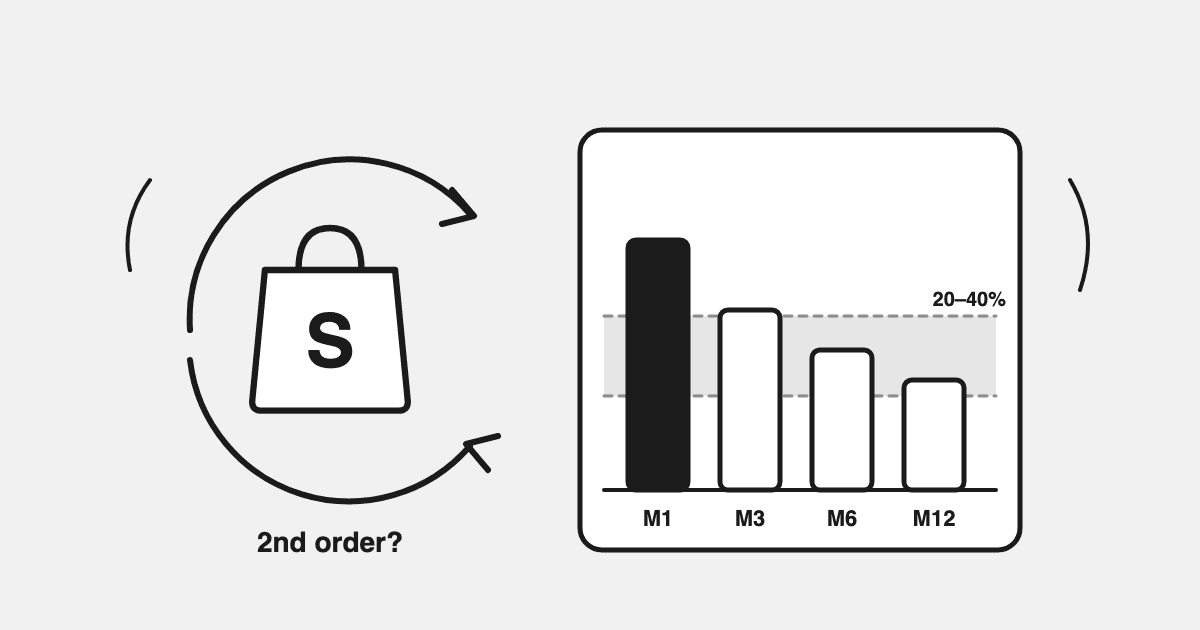
A good repeat purchase rate for a Shopify store is 20–40%, with the all-ecommerce average around 27–28%. Under 20% means acquisition is doing all the work; above 35% means retention is a genuine engine. But that blended number hides more than it reveals — the operators who manage retention well track it by cohort month: M1, M2, M3, and M12.
Ask five analytics tools for your repeat rate and you'll get five numbers, because they're answering five different questions. This guide defines each version precisely, gives you benchmarks for the blended rate and the cohort view, and shows which single number is actually worth managing.
One question before any benchmark: what is your repurchase window? A supplements brand whose customers reorder every ~45 days and an apparel brand whose customers come back once a year are both "Shopify stores", but a healthy M1, the timing of every lifecycle email, and the ROAS you can afford on a first order are different numbers for each. Every benchmark below assumes you've named yours.
TL;DR
- Blended repeat purchase rate = repeat customers ÷ total customers in a window. Ecommerce average ≈ 28%; 20–40% is the healthy band; category matters more than the average (grocery ~65%, luxury ~10%).
- Cohort repeat rate (M1–M12) = of customers acquired in a given month, what % have bought again by month N. This is the version that tells you whether retention is improving.
- Real cohort data from two replenishable-category stores on DataDrew: M1 of 5–11%, M3 of 11–20%, M12 of 23–27%.
- The highest-leverage number: the % of first orders that ever become second orders — and how many days that takes.
- Repeat rate by first product purchased can span ~3x inside one store — which means allowable CAC should be set per entry product, not per store.
- Low M1 with rising CAC is often an acquisition problem (wrong customers, wrong price), not a retention problem. Cohort by channel before you touch email.
What Repeat Purchase Rate Actually Measures (and the Formula)
Repeat purchase rate (RPR) = customers with 2+ orders ÷ total customers, over a chosen window.
Two things people get wrong:
- The window changes everything. An all-time RPR flatters you (old customers had years to reorder). A 12-month window is the standard for comparability.
- RPR is customer-based, not order-based. "Repeat order rate" (repeat orders ÷ total orders) runs higher and gets quoted interchangeably. When a benchmark looks suspiciously good, check which formula it used.
Related but different: returning customer rate in Shopify's dashboard counts the share of orders in a period placed by anyone who has ever ordered before — useful, but not the same metric, and inflated by long-tenured stores.
What's a Good Blended Repeat Purchase Rate?
Cross-industry averages put ecommerce RPR at ~27–28%, but the spread by category is enormous — benchmarking against the wrong category is worse than not benchmarking:
| Category | Typical RPR (12-mo) |
|---|---|
| Grocery & consumables | 50–65% |
| Beauty & supplements | 25–40% |
| Fashion & apparel | 20–30% |
| Pet | 25–35% |
| Home & furniture | under 15% |
| Luxury / high-AOV durables | ~10% |
A simple read on your own number:
- Under 20%: every month restarts from zero; growth is fully paid-acquisition dependent. (This is why retention-first growth beats CAC-first growth at most Shopify sizes.)
- 20–30%: a functioning retention engine for most categories.
- 35%+: strong — usually a replenishable product plus deliberate lifecycle work, not luck.
If your product can't structurally repeat (mattresses, engagement rings), stop optimizing RPR and manage AOV, referral, and contribution margin instead.
The Blended Number Lies: Why Operators Track M1–M12 Instead
Here's the problem with one blended percentage: it mixes customers acquired last month with customers acquired two years ago. Your RPR can rise while your retention worsens, simply because older cohorts pile up.
The fix is cohort tracking — and it comes with vocabulary merchants use constantly but almost nobody defines:
- M0 — the acquisition month. Everyone in the cohort bought once by definition.
- M1 repeat rate — % of the cohort that placed a second (or later) order within 1 month of first purchase.
- M2, M3 … M12 — same, cumulative, by month 2, 3 … 12.
- M12 repeat rate — the cohort's one-year repeat rate: of everyone who first bought in June 2025, how many bought again by June 2026.
- L12 — shorthand for the last-12-months view of the same idea.
Read cohorts in two directions: across a row (how one month's customers mature) and down a column (is M3 for the June cohort better than M3 for the January cohort? — that's whether retention is actually improving). Our cohort analysis guide walks the full method.
What Does a Good M1 / M3 / M12 Look Like? (Real Cohort Data)
We pulled January–August 2025 acquisition cohorts — every cohort at least 12 months mature — for two replenishable-category stores on DataDrew: a UK personal-care brand (4,427 first-time customers in the window) and a German supplements brand (20,571 first-time customers). Their cumulative repeat rates, by day-window equivalent of M1/M3/M12:
| Cohort window | UK personal care | German supplements |
|---|---|---|
| 30-day (≈M1) | 11.0% | 4.8% |
| 90-day (≈M3) | 19.8% | 11.2% |
| 12-month (≈M12) | 27.1% | 23.3% |
Three reads from this data:
- Both stores end inside the healthy 20–40% band at 12 months — but they get there on very different curves. The personal-care brand front-loads repeats (40% of its eventual repeaters are back within 30 days); the supplements brand's curve builds slowly and keeps climbing past M3.
- Rules of thumb for replenishables: M1 of 5–12% is normal (15%+ is excellent), M3 of 12–20% is healthy, and M12 should approach your blended category benchmark. If M12 sits far below your blended RPR, old cohorts are propping up the average.
- The entry product matters more than the store average. Inside the UK store, 12-month repeat rate by first product purchased ranged from 12.1% to 37.8% — a 3x spread within one store. The store-level number is an average of very different customer types; the per-product cohort tells you which acquisition to feed.
For durable categories, shift everything right: M1 near zero is fine, and M6–M12 is where repeats appear at all.
Which First Product Creates Repeat Buyers? The 3x Spread
The single most useful cut of repeat rate isn't by month. It's by first product purchased. Inside the UK store above, customers whose first order was one product came back at 12.1% over 12 months; customers who started with another came back at 37.8%. Same store, same emails, same brand — a 3x difference in whether the customer ever returns, decided at the moment of the first purchase.
The reason is simple: the entry product selects the customer. Someone whose first order is a routine consumable is on a schedule from day one. Someone who bought a gift set, a one-off, or a heavily discounted trial is not. The store-level repeat rate averages those two people together and describes neither.
How to run it: group first-time customers by the product (or collection) in their first order, then compute second-order rate and M12 for each group. Ignore any entry product with fewer than a couple of hundred first-time customers in the window — small cohorts swing wildly. Then act on the spread in three places:
- Acquisition: set allowable CAC per entry product, not per store. Allowable CAC ≈ first-order contribution margin + (second-order rate × second-order margin) + whatever later orders are worth. A product that brings 35% of its buyers back can carry an acquisition cost that a 12% product can't. Route prospecting budget and creative toward the high-repeat entry products; let low-repeat products live on retargeting and cross-sell.
- Merchandising: make the high-repeat product the default first purchase. Hero placement, the first-order offer, the bundle that leads with it. You're not just selling a product; you're choosing which kind of customer you acquire.
- Lifecycle: write the post-purchase flow per entry product (next section). A customer who started with a 30-day consumable and one who started with a durable need different messages on different days.
Our product intelligence guide covers the mechanics of finding gateway products; the point here is that the repeat-rate benchmark you should manage is the one attached to the products you're paying to sell.
The One Number to Manage: First Order → Second Order
Across the retention questions brands ask our AI analyst — "what % of first orders converted to second orders in the last 3 months?", "how many days until the next repurchase?" — the pattern is consistent: the second order is where retention is won or lost.
Two numbers to pull today:
- Second-order conversion rate — of first-time customers in a cohort, % who ever place order #2. A customer who buys twice is roughly 2x as likely to buy a third time as a one-timer is to buy a second; the third-to-fourth jump is higher again. The steepest cliff in the whole curve is between order 1 and order 2 — spend your effort there.
- Median days between first and second order — this sets your lifecycle timing. If your median gap is 45 days, your winback flow firing at day 90 is 45 days late. Time post-purchase flows to just before the median gap, per product line if the gaps differ.
This is also where repeat rate connects to money: repeat behavior drives LTV, and LTV sets what you can pay for a customer (the 3:1 LTV:CAC logic). The full math lives in our customer LTV guide for Shopify brands.
Wire the second order into your post-purchase flow
Knowing the median gap is only useful if the flow is timed to it. The rule: the flow fires before the median days-to-second-order, not after.
- Timing. First message at roughly half the median gap (a use-up or "how's it going" touch, no offer). Second message at the median, with the reorder path one tap away. Winback starts at about 1.5x the median — anyone still silent at that point has already broken pattern. If supplements come back at ~45 days and skincare at ~70, that's two flows, not one flow with an average.
- Content by product type. Replenishables: a reorder reminder plus a subscribe option — lead with convenience, not a discount, because these customers were coming back anyway. Multi-SKU catalogs: the product that most often follows the first one (your data has this; it's the next-best product for that entry SKU). Durables: don't push a second unit — offer the accessory or consumable that goes with it, and ask for the referral.
- Measure it the same way you benchmark. Second-order conversion rate for customers who received the flow vs the cohorts before it existed, read 60 days later. If the number didn't move, the timing is wrong before the copy is.
When Low M1 Is an Acquisition Problem, Not a Retention Problem
If M1 is sitting at the bottom of the range and paid CAC is rising, the instinct is to fix retention: more email, a loyalty program, a bigger second-order discount. Ask a different question first: are we acquiring the wrong customers at the wrong price?
Cut your cohorts two more ways before you touch lifecycle:
- By acquisition channel and campaign. If one channel's cohorts convert to a second order at half the store rate, those customers were cheap to acquire and expensive to keep. Its first-order CPA can look like the best in the account while its 90-day cohort revenue is the worst.
- By first-order offer. Discount-led first orders repeat less than full-price ones in most catalogs. A great "cost per first order" bought with a 40% code can be a terrible cost per repeat customer.
What changes when you find it: move budget away from channels whose cohorts don't repeat, even if their first-order ROAS is prettier; raise the CAC ceiling on channels whose cohorts do; and grade campaigns on 90-day cohort contribution, not first-order ROAS. That's the same logic as our cut-or-feed budget framework, applied one layer deeper — and it's why blended ROAS can't see a retention problem that was really an acquisition problem.
How to Measure This in Shopify
Shopify's native analytics gives you returning-customer rate and a basic cohort report, but it can't answer the questions above at the level you'll act on: cumulative M1–M12 by acquisition month, second-order conversion by first product purchased, or median days-to-second-order per SKU.
Options, in ascending order of effort:
- Shopify admin — direction, not precision: watch returning-customer rate trend.
- Spreadsheet cohorts — export orders, pivot by first-purchase month. Accurate, painful, goes stale immediately.
- Ask your data directly — brands on DataDrew ask Drew in plain English: "What's my M1, M2, M3 and M12 repeat rate?", "Which first product leads to the best second-order rate?", "Days until next repurchase, per product?" — and get cohort tables computed from their live store data. The questions in this post are near-verbatim from what merchants ask it every week.
A Weekly Cohort Routine: What to Track, Where, How Often
Benchmarks tell you where healthy is. They don't tell you how to keep watching. Cohorts move slowly, so most of this is weekly and monthly, not daily — the mistake is checking M-rates every morning and reacting to noise.
| Track | Cadence | Where | Act when |
|---|---|---|---|
| Second-order conversion rate (90-day) | Weekly | Orders grouped by customer, or ask Drew | Falls vs the prior 4 weeks → flow timing or offer changed |
| Median days to second order, per product line | Monthly | Same cohort, per entry product | Shifts by more than ~10 days → re-time the post-purchase flow |
| M1 repeat rate by acquisition month | Monthly (cohorts need 30 days to mature) | Cohort report | Below your trailing 6-cohort average two months running → acquisition mix changed |
| Repeat rate by acquisition channel | Monthly | Cohort report split by first-touch channel / campaign | A channel below store average → lower its CAC ceiling |
| Repeat rate by first product purchased | Quarterly | Cohort report split by entry SKU | Top-vs-bottom spread widens → re-route prospecting budget |
| M3 and M12 by cohort | Quarterly | Cohort report | M12 well below blended RPR → old cohorts are propping up the average |
One person owns the sheet (or the saved question), and the number that gets read every week is the second-order conversion rate — it moves fastest and it's the one every other row eventually shows up in.
How to Raise Repeat Purchase Rate (Briefly)
The levers, in rough order of ROI for most stores: time lifecycle email to the days-to-second-order gap, not the calendar · make the second-order offer product-specific (which first product predicts repeats matters more than the discount size) · fix RFM segmentation in Klaviyo so winbacks target Should Not Lose, not everyone · and treat subscription as a retention product, not a checkbox. Each deserves its own post; the benchmark's job is telling you whether to bother.
FAQ
What's the average repeat purchase rate for Shopify stores?
Around 27–28% blended across ecommerce, with category ranges from ~10% (luxury/durables) to 65% (grocery/consumables). 20–40% is the commonly cited healthy band.
What is M1/M2/M3 repeat rate?
The cumulative % of a monthly acquisition cohort that has placed a second order within 1, 2, or 3 months of their first purchase. M12 is the one-year version and the fairest single retention number to compare over time.
Is returning customer rate the same as repeat purchase rate?
No. Shopify's returning-customer rate is order-based within a period and inflated by store age; repeat purchase rate is customer-based within a defined window. Use RPR (or cohort M-rates) for benchmarking.
How do I know if a low repeat rate is an acquisition problem?
Split cohorts by acquisition channel and by first-order offer. If one channel or one discount code produces customers who convert to a second order at well below the store rate, you're buying the wrong customers, and no amount of lifecycle email fixes that. Move budget before you rewrite flows.
When should my post-purchase flow send?
Before the median days-to-second-order for that product line, not after. A first touch at about half the gap, the reorder message at the gap, and winback at roughly 1.5x — timed per product line if the gaps differ.
What repeat rate do I need for my LTV:CAC to work?
There's no universal cutoff — but if your 12-month repeat rate is under ~15% in a replenishable category, your LTV is close to first-order contribution margin, and your allowable CAC should be set accordingly. Full math in the LTV guide.