A good LTV to CAC ratio for an ecommerce brand is about 3:1, measured on margin, not revenue. But most Shopify stores calculate it in a way that inflates it. One brand asked its AI agent for its LTV:CAC over the last three months and got somewhere between 12x and 17x. The agent's next line was that the number was almost certainly overstated, and it listed why. If your ratio is above about 8x, assume it's a measurement problem before you assume it's a great business.
The session below comes from Drew, DataDrew's AI agent for Shopify. The brand isn't named, and we only show ratios, not money. The worked examples use invented round numbers.
TL;DR
- LTV:CAC = what a customer is worth ÷ what it cost to win them. 3:1 on margin is the common target for ecommerce.
- Five things inflate it: spend you left out, customers ads didn't buy, revenue instead of margin, tax and shipping in revenue, and LTV and CAC taken from different customers.
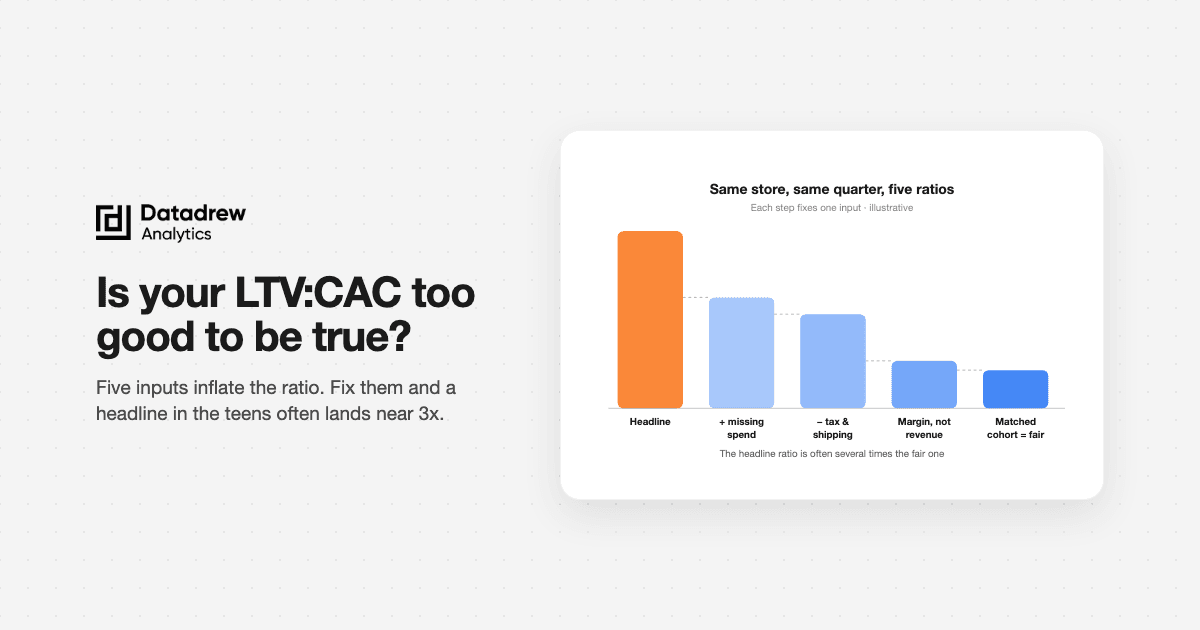
- One brand's 12-17x shrank fast once those were named. In our worked example, the same mistakes turn a fair 3.2x into a headline 15x.
- Blended and paid CAC answer different questions. Blended can say 3x while paid says 1.3x. Both are true.
- Run the inverse check: how much more would you have to spend to fall to 3x? If the answer is "5x your budget," your inputs are missing something.
- Set a target from your own baseline. Move two or three levers by amounts you've seen before, then account for Q4 ad costs. That's a target your boss can't call textbook.
What is the LTV to CAC ratio?
The LTV to CAC ratio compares how much a customer is worth over their lifetime with how much you spent to acquire them. A 3:1 ratio means each customer brings back three times what they cost.
- LTV (lifetime value): the margin a customer generates over a set period, usually 12 months.
- CAC (customer acquisition cost): marketing spend in a period ÷ new customers in that period.
- The ratio: LTV ÷ CAC.
It's the one number that tells you whether growth pays for itself. That's why bosses ask for it, and why it's worth getting right.
How do you calculate LTV to CAC?
Here's the formula that holds up for a Shopify store:
LTV:CAC = (12-month margin per new customer) ÷ (all acquisition spend ÷ new customers)
- Pick a cohort. For example, customers whose first order was in Q2.
- Add up their margin for 12 months. Use revenue after discounts and refunds, minus tax, shipping, product cost and fulfilment.
- Divide by the number of customers in the cohort. That's LTV.
- Add up all acquisition spend in the same period. Every ad channel, including marketplace ads, plus influencer, affiliate and agency fees.
- Divide by the new customers you acquired in that period. That's CAC.
- Divide LTV by CAC.
If you don't have 12 months of data, use 90-day LTV and say so. A 90-day ratio and a 12-month ratio aren't comparable. Our customer LTV guide covers the LTV side in more detail.
Why did one brand get 12-17x?
The brand asked one question: "What is the LTV to CAC in the past 3 months?"
The agent pulled spend from the one ad channel that was live and connected. It then divided by every new customer in the window. Depending on which LTV it used, it got between about 12x and 17x. That's four to five times the usual target.
Then it explained why it didn't trust the number:
- Marketplace ad spend was missing. The reports were still generating.
- A big share of new customers came from organic search. They were counted in the denominator anyway.
- LTV was revenue, not margin. Product costs weren't in the data.
- Revenue included tax and shipping.
- The newest customers were too young to judge. Under 1 in 15 had reordered, against about 1 in 4 in an older cohort.
It also ran a sanity check. Spend would have to rise roughly 3.5-6x before the ratio fell into the 3-5x range. Nobody runs a business where ads are that cheap. A gap that size means inputs are missing.
That list is the useful part. Each item is a way your own ratio is probably inflated.
What makes an LTV:CAC ratio look better than it is?
1. Spend you left out
CAC only counts the spend you include. Common gaps:
- Marketplace ads (Amazon, Flipkart and similar) when customers cross over to your store
- A paused or disconnected ad account that still spent in the window
- Influencer, affiliate and agency fees
- Creative production
- Discounts given to win first orders
Leave out a third of your spend and your ratio goes up by half.
2. Customers your ads didn't buy
Blended CAC divides all spend by all new customers. That includes people who found you through search, word of mouth or a marketplace. It's a fair number, as long as you call it blended.
The problem starts when you treat it as the cost of buying a customer with ads. If half your new customers came in organically, your paid CAC is roughly double your blended CAC.
3. Revenue instead of margin
A customer who spends 100 with a 45% gross margin is worth 45 to you, not 100. Revenue LTV divided by CAC can look more than twice as healthy as margin LTV divided by CAC. Every major source on this metric agrees: use margin. If your product costs aren't loaded into Shopify, this is the first thing to fix. See contribution margin before scaling.
4. Tax and shipping inside revenue
Shopify's order total includes tax and the shipping fee the customer paid. Neither is yours to keep. In some markets that's 10-20% of the order. Use net sales: after discounts and refunds, before tax and shipping.
5. LTV and CAC from different customers
The cleanest mistake to miss. You take LTV from a mature cohort, say customers acquired a year ago. Then you divide it by this quarter's CAC.
But this quarter's customers may repeat less. They may have come in on a discount or through a different channel. You're crediting today's spend with yesterday's loyalty. Match them: measure the LTV of the customers that the spend actually bought, or adjust the mature LTV for how the new cohort is tracking. Our cohort analysis guide shows how to compare cohorts side by side.
Worked example: from 15x to 3.2x
Illustrative numbers, not a real store.
A store spends 50,000 a quarter on one search channel and gets 5,000 new customers. Its average customer has spent 150 over 12 months.
| Step | LTV | CAC | Ratio |
|---|---|---|---|
| Headline: search spend only, revenue LTV | 150 | 50,000 ÷ 5,000 = 10 | 15x |
| Add 20,000 marketplace ads + 10,000 influencer and agency fees | 150 | 80,000 ÷ 5,000 = 16 | 9.4x |
| Strip tax and shipping (about 15% of revenue) | 128 | 16 | 8x |
| Use 50% margin instead of revenue | 64 | 16 | 4x |
| Match the cohort: this quarter's customers are tracking about 20% below the old cohort | 52 | 16 | 3.2x |
No step looks like a big mistake on its own. Together, they make the headline almost five times the fair ratio.
Should you use blended CAC or paid CAC?
Use both, and label them. They answer different questions.
- Blended CAC (all spend ÷ all new customers) asks: is the whole growth engine paying back?
- Paid CAC (paid spend ÷ customers acquired through paid) asks: is the next unit of ad spend worth it?
Illustrative, continuing the example above. Say analytics credits 2,000 of the 5,000 new customers to paid channels. Paid CAC is 80,000 ÷ 2,000 = 40. With LTV at 52, paid LTV:CAC is 1.3x, while blended stays at 3.2x.
So the business is healthy, but the ads alone are barely paying back. That matters before you double the budget. Attribution is imperfect, so treat paid CAC as a range, not a fact. Our post on what blended ROAS can't tell you covers the same split for ROAS, and marketing efficiency ratio covers the blended view.
What is a good LTV to CAC ratio for ecommerce?
Measured on margin over 12 months, here's how to read it:
| LTV:CAC (margin, 12 months) | What it usually means |
|---|---|
| Below 1x | You lose money on every new customer |
| 1-2x | Thin. Only works if payback is fast or retention is strong |
| 2-3x | Workable, especially early on |
| 3-5x | Healthy. Room to scale |
| 5-8x | Probably under-spending. Test more budget |
| Above 8x | Check your inputs before you celebrate |
The ranges commonly quoted shift by category. Brands with frequent reorders (food, supplements, beauty, subscriptions) tend to run higher. Brands that sell durable, rarely repeated products (furniture, mattresses) often run 1.5-2.5x and still do fine on first-order margin.
On revenue rather than margin, everything shifts up. That's why "3:1" means nothing until you say which one you used.
Why is a very high ratio a warning?
There are only two ways to reach 12x on margin. Either you have a rare business with cheap customers who reorder for years, or something's missing from the maths. The second is far more common.
If the ratio is real, it's still a signal: you're probably leaving growth on the table by not spending more.
How do you sanity-check your ratio?
Ask the inverse question: how much would spend have to rise for the ratio to fall to 3x?
Rough version, holding LTV and customer count fixed: spend needed ≈ current spend × (current ratio ÷ 3).
- At 15x, you'd need about 5x your current spend.
- At 4x, you'd need about 1.3x.
If the answer is several times your budget, you're either very under-invested or missing inputs. Check the five sources above first. It's a crude check, because more spend brings more customers, but it catches big errors in seconds.
How do you set a realistic LTV:CAC target for year end?
The agency in our second session got a message from their boss: "First thing we need is the baseline. What's the number today? Then a realistic target by year end. Based on where we actually are, not a textbook number."
That's the right question. Here's how to answer it.
- Lock the baseline. Calculate a fair ratio for last quarter using the steps above. Write down the definition next to it.
- Split it into levers. LTV moves with first-order margin, repeat rate and order value. CAC moves with ad costs, conversion rate and channel mix.
- Move each lever by an amount you've hit before. Your best quarter's repeat rate is a fair stretch. A competitor's is not.
- Price in the season. Q4 ad costs usually rise. If you plan to spend more in November, CAC will likely go up too.
- State the target as a range with the definition attached.
Worked example: a year-end target
Illustrative numbers, continuing from the 3.2x baseline.
- Baseline: LTV 52, CAC 16, ratio 3.2x.
- Repeat rate: 12-month repeat rate was 20% and hit 23% in your best quarter. Getting back there adds about 2 to LTV.
- Margin: a supplier renegotiation lifts gross margin 2 points. That adds about 2 to LTV.
- New LTV: about 56.
- Q4 ad costs: CAC up about 15% in November and December, to roughly 18.4.
- Ratio if CAC rises: 56 ÷ 18.4 = about 3.0x.
- Ratio if CAC holds: 56 ÷ 16 = 3.5x.
So the target is 3.0-3.5x on 12-month margin LTV, blended CAC. It sounds less exciting than "get to 5x." But it's honest, it's tied to levers someone owns, and holding the ratio while spending more in peak season is real growth.
How long should payback take?
The ratio tells you if a customer pays back. Payback period tells you when. That decides how much cash you need to grow.
Payback (months) = CAC ÷ monthly margin per customer
A 3x ratio that pays back in two months lets you reinvest fast. A 3x ratio that takes 18 months ties up cash for a year and a half. For most Shopify brands, aim for first-order margin to cover most of CAC, and repeat orders within the first 90-180 days to cover the rest.
If you know your 90-day margin LTV, the most you can pay for a customer and break even in 90 days is that number. Pay less if you want profit inside the quarter.
How do you calculate LTV:CAC in Shopify, step by step?
- Load product costs into Shopify, or have a margin assumption you're comfortable defending.
- Export orders with customer IDs, dates, net sales, tax, shipping and refunds.
- Tag each customer's first order and group customers by the month or quarter it fell in.
- Sum 12-month margin per cohort. Divide by cohort size for LTV.
- Collect spend from every channel for the same period, including marketplace ads and fees.
- Divide spend by new customers in that period for blended CAC. Repeat with paid-only spend and paid-attributed customers for paid CAC.
- Divide, label and date it. For example: "3.2x, 12-month margin LTV, blended CAC, Q2 cohort."
A spreadsheet works for one quarter. It gets painful when you want it monthly. An agent that reads Shopify and your ad accounts directly can rerun it on demand, and a good one will tell you what's missing, like the session above did.
What prompts can you paste into Drew?
Copy these into Drew and change the dates:
- "What's my LTV to CAC for customers acquired in Q2, using 12-month margin LTV and blended CAC across every connected ad account? List anything missing from the inputs."
- "Split CAC into blended and paid-only for the last 90 days. How many new customers came from paid?"
- "Compare 90-day LTV for customers acquired this quarter against the same quarter last year."
- "How much would ad spend need to rise before my LTV:CAC fell to 3x?"
- "My boss wants a realistic year-end LTV:CAC target. Show my baseline, my best quarter for repeat rate and margin, and a target range for December."
The first prompt asks the agent to list missing inputs. That's the most important line in it.
FAQ
What is a good LTV to CAC ratio?
About 3:1, measured with margin LTV over 12 months. Between 3x and 5x is healthy. Below 1x loses money on every customer. Above 5x usually means you can spend more, and above 8x usually means an input is missing.
Is LTV:CAC calculated on revenue or profit?
Use margin (profit after product, fulfilment and payment costs). A revenue ratio can look more than twice as healthy as a margin ratio for the same store. If you must use revenue, label it.
Should CAC include organic customers?
Blended CAC does, and that's fine for judging the whole business. For decisions about ad budget, also calculate paid CAC: paid spend divided by customers acquired through paid.
Can your LTV:CAC be too high?
Yes. A real ratio above 5x often means you're under-investing in growth. A ratio above about 8x is more often a measurement error: missing spend, revenue instead of margin, or a mature cohort's LTV against new CAC.
How often should I measure LTV:CAC?
Monthly for trend, quarterly for decisions. Keep the definition the same every time, or the trend means nothing.
How do I set a realistic LTV:CAC target?
Start from a fair baseline. Move repeat rate, margin and order value by amounts you've achieved before. Then account for seasonal ad costs. State the target as a range with its definition.
What's the difference between LTV:CAC and payback period?
LTV:CAC says whether a customer pays back. Payback period says how fast. You need both: a high ratio with a slow payback can still run you out of cash.
How does churn affect LTV:CAC?
Churn caps LTV. If customers stop ordering sooner, LTV falls and the ratio falls with it. See how to calculate customer churn and repeat purchase rate benchmarks.