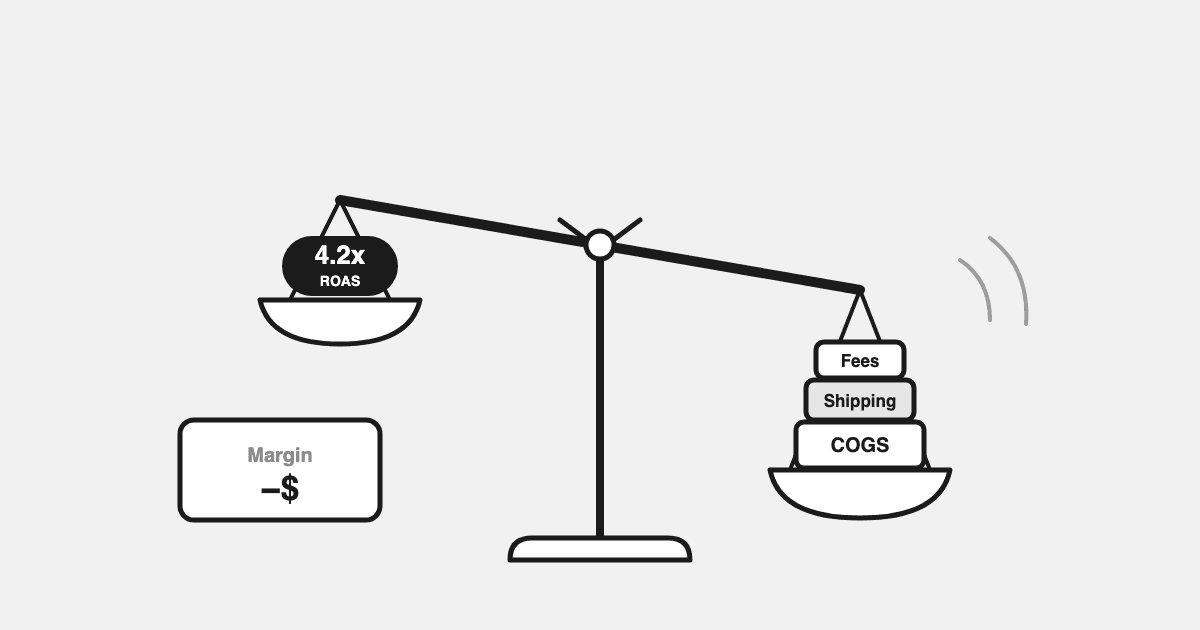
Before you scale ad spend on any Shopify product you need three numbers: CM1 (net revenue minus landed COGS), CM2 (CM1 minus fulfilment, 3PL and payment fees) and CM3 (CM2 minus ad cost), because a product with a positive CM1 and a negative CM3 turns every budget increase into a faster loss. Platform ROAS cannot show you which of your products that is. The margin math can, and it takes one afternoon.
Here is what it looks like when nobody runs it. A Shopify brand came to DTC growth operator Curtis Howland showing 4.2x ROAS on Meta. He pulled the contribution margin picture the ROAS column hides: a 35% new-customer ratio, so 65% of the "conversions" were returning customers who would probably have bought anyway; COGS at 48%; platform fees eating another 8%. The 4.2x ROAS translated to a $15,000 loss that month. His line for it: "When Meta says ROAS is 4x and your P&L says you lost money, your P&L is right."
This is for the founder-operator at the first real scaling push and the growth lead whose CFO has started asking. Here is the check a budget raise should pass first: contribution margin, per product, before the money moves. The calculator at the bottom does the arithmetic from numbers you already have.
TL;DR
- CM1 = net revenue − landed COGS. CM2 = CM1 − fulfilment, 3PL, payment fees and returns. CM3 = CM2 − ad cost. Most brands know CM1 for the store; almost none know CM2 per SKU, and CM2 is where the ad decision lives.
- Break-even ROAS = price ÷ CM2 per unit (the same thing as 1 ÷ CM2 %). It is a per-product number. An account-level break-even of 2.5x hides the 21%-margin SKU that loses money at 4x.
- The same 4.2x ROAS on four products can mean scale, stop, wait for the cohort and don't strand the budget. Margin is the first gate; repeat behaviour and stock cover are the second and third.
- The scale-readiness check runs economics first. If a SKU fails it, "no increase" is the decision, and constraining, re-pricing or clearing are the moves.
CM1, CM2, CM3: where the margin goes on a Shopify order
Contribution margin is what one order leaves you after every cost that scales with that order. Operators split it into three levels, and each level answers a different question: CM1 asks whether the price covers the product, CM2 asks whether you can afford to ship and process it, CM3 asks whether you can afford to advertise it.
| Level | Formula | The line items people forget |
|---|---|---|
| CM1 | Net revenue − landed COGS | Inbound freight, duties, and the discount coming off the top of revenue |
| CM2 | CM1 − fulfilment − payment fees − returns | 3PL pick-pack, the shipping subsidy on "free shipping", processing at roughly 2.9% + 30¢ on Shopify Payments, the return label, the unit that doesn't go back on the shelf |
| CM3 | CM2 − ad cost | The ad cost of the order, which the platforms report in aggregate and Shopify doesn't hold at all |
Bloom Analytics puts the benchmark at CM2 above 50% as healthy for a DTC store and below about 30% as risky to scale, because one shipping increase or one extra discount week erases what is left. Treat that as a third-party rule of thumb; the per-SKU spread inside your own catalog matters more than the store average.
Worked on a $60 product, level by level:
| Line | Per order | Level |
|---|---|---|
| List price | $60.00 | |
| Average discount (10%) | −$6.00 | Net revenue $54.00 |
| COGS, landed | −$18.00 | CM1 $36.00 (66.7%) |
| Shipping and fulfilment | −$7.50 | |
| Payment and platform fees (~4% of net) | −$2.16 | |
| Expected returns cost (8% return rate) | −$2.88 | CM2 $23.46 (43.4%) |
| Ad cost of the order | ? | CM3 is what is left after this line |
Two things people forget. Discounts come off the top, so a 10% code is a 10% cut in revenue but nearly a 25% cut in this product's CM2. And returns cost more than the refund: the outbound shipping is gone, the return label is yours, and the unit may not go back on the shelf.
Now do that per product, or at least per margin band. That is the version most brands have never computed, and it is where the scaling decision lives.
Break-Even ROAS per SKU, Not per Account
Break-even ROAS is the ROAS at which CM2 exactly covers the ad cost of the order: price ÷ CM2 per unit, or 1 ÷ CM2 %. At 43.4% margin the $60 product breaks even at 2.30x. Every point of platform ROAS above that is CM3; every point below it is a subsidy.
| CM2 before ads | Break-even ROAS | A 4.2x ROAS means |
|---|---|---|
| 20% | 5.00x | A loss on every order |
| 30% | 3.33x | Thin, and one discount away from a loss |
| 40% | 2.50x | Comfortable |
| 50% | 2.00x | Room to scale into a falling marginal number |
| 60% | 1.67x | Very profitable; the ceiling is stock or demand, not economics |
Here is why the account-level version is dangerous. Say blended CM2 is 40%, so the store breaks even at 2.5x, and the account runs at 4x. Healthy. But the catalog is a mix: a 62%-margin hero and a 21%-margin accessory line that gets a third of the spend because it converts well. The accessory line breaks even at 4.8x. It is losing money at 4x, and the account average is laundering it. Sean Frank of Ridge puts the floor at the account level as "You need to be able to survive, I think, a 1.5X ROAS"; the per-SKU version of his rule is that you need to know which products survive it.
A published profit-analytics example makes it concrete: a t-shirt at 3.5x ROAS, with 25% returns and $10 shipping, that loses $2.40 on every sale once COGS is in. The ROAS column will never show you that. Only the margin math does.
Same ROAS, Four SKUs, Four Different Decisions
Take four products all running at 4.2x platform ROAS. Same number, four different calls.
| Product | CM2 | Break-even ROAS | The other facts | Decision at 4.2x |
|---|---|---|---|---|
| A | 62% | 1.6x | 90 days of stock, steady conversions | Scale. Passes economics, stock and volume; the only question is the marginal read |
| B | 21% | 4.8x | Converts well, sits in the same catalog campaign | Stop. 4.2x is a loss on every order; constrain exposure or fix the offer economics |
| C | 38% | 2.6x | First-order ROAS actually 2.2x, but customers who start here repeat at three times the store average | Wait for the cohort. Below break-even on the first order; the 90-day cohort by first product decides |
| D | 55% | 1.8x | Eight days of stock left, restock in three weeks | Don't raise. Scaling strands the budget on a sold-out page in a week |
That is the whole argument in one table. The same ROAS should not lead to the same budget decision, and the platform cannot make the distinction because it holds none of the columns except the ROAS.
Product C is where operators get brave or get burned. Buying a customer below first-order break-even is correct when the repeat behaviour of customers who start on that product pays it back inside a window you can afford. That is a cohort question: LTV by first product, measured on Shopify orders, three, six and twelve months out. It is never a campaign-level question, because there is no reliable join from an ad to the order it caused. If you want the shape of the data, our repeat-purchase benchmarks by month show how far first products diverge.
What the Platforms and Shopify Report vs What CM3 Needs
None of these numbers is wrong. Each answers a different question, and CM3 needs a column from every source.
| Source | What it reports | What CM3 takes from it | What it does not hold |
|---|---|---|---|
| Meta and Google | Spend, platform-attributed revenue and ROAS; spend per product for catalog and Shopping formats | The ad cost line, at account, campaign and (approximately) product level | COGS, fulfilment, fees, returns |
| Shopify | Net sales, discounts, refunds, cost per item, profit-margin-by-order reports, processing fees in the finance reports, inventory by variant | Net revenue, CM1 if cost per item is maintained, refunds, stock cover | Landed cost beyond cost per item, 3PL and packaging, any ad cost |
| 3PL, carrier, gateway | Pick-pack fees, postage, processing fees | The fulfilment and fee lines of CM2 | Revenue or ads |
Shopify's profit reports get you to gross profit, which is CM1 by another name. CM2 needs the cost lines that sit in other systems; CM3 needs the ad cost that sits in the platforms. Nobody in the stack holds the whole ladder, which is why the per-product version gets assembled, once, in a sheet.
The Scale-Readiness Check, With Margin as the First Input
Every budget increase should pass this, in this order. The order matters: economics runs first because if a product fails it, nothing downstream can save the raise.
| Gate | Pass looks like | Fail looks like |
|---|---|---|
| 1. Economics vs your real target | The products the spend lands on clear their break-even with room, at the ROAS you actually run at (not the one you hope for) | A meaningful share of the spend sits on SKUs below break-even, or the raise only works at a target the account has never hit |
| 2. Conversion volume and stability | Enough orders in the window that the ROAS reading is not one big basket | A "4.2x" built on nine orders |
| 3. Time since the last material edit | A full conversion cycle since the last budget, creative or audience change | You changed something on Tuesday and it is Thursday |
| 4. Stock cover | Weeks of cover on the products the raise will sell, at the higher run rate | Days of cover; the raise sells out the hero and the ads keep spending. That leak has its own check |
| 5. New-customer share of that product's orders | Most of the product's orders are first orders, so the spend is buying growth | Howland's 35%: two-thirds of the "conversions" are existing customers the ad did not need to reach |
| 6. Marginal ROAS trend so far | The last step earned close to the average | The last step earned a fraction of the average. How to read the marginal number |
Gate 5 is measured from Shopify orders at shop or product level, or from the platform's own new-customer reporting at account level. Never per campaign or per ad: the ad-to-order join does not exist, and pretending otherwise is how the 4.2x month happened.
What to Do When a SKU Fails the Check
Three moves, and a fourth that is the most under-used decision in paid media.
- Constrain exposure. Exclude it from the scaled catalog campaign or product set, give it a custom label with a lower target, or cap the budget of the campaign it lives in. You are not killing the product, you are stopping the ads from buying it below cost.
- Fix the offer economics. A price change, a bundle that lifts the order value, a shipping threshold that cuts fulfilment cost per order, or a smaller default discount. Recalculate CM2 after every one of these; a "10% off" test is a margin decision wearing a conversion-rate costume.
- Clear within margin rules. If it is stock you need gone, set the ROAS floor at break-even for that SKU, treat the spend as harvest rather than growth, and stop the moment the floor breaks.
- Don't increase. Not "increase 10% and watch". Leave the budget where it is and work on the gate that failed. No raise is a decision, and on a failing SKU it is usually the right one.
Where the Numbers Come From on a Shopify Stack
You do not need a data team for this. You need three sources and one spreadsheet.
- Orders, order items, inventory: direct from Shopify. Revenue by product, discounts, refunds, units on hand by variant. High confidence.
- Margins: yours to provide. Shopify's cost-per-item field gets you to gross profit, but landed cost, 3PL and returns live elsewhere, and Datadrew does not ingest COGS or compute contribution margin. A margin-band sheet per SKU (A: CM2 over 55%, B: 40–55%, C: under 40%) is enough to start, and it is the version you share with Drew.
- Spend per product: approximate. Meta's product breakdown and Google's product report give spend per item for catalog and Shopping formats; single-product ads map by landing page or creative subject. Datadrew allocates campaign and ad spend to products by approximation, so treat per-SKU ROAS as a range and let the margin band do the deciding.
The account-level backstop still matters: blended ROAS on Shopify revenue tells you whether the whole business is efficient even when the per-product split is fuzzy. What it can and can't tell you, and how to set the break-even MER for the store as a whole.
Contribution Margin and Break-Even ROAS Calculator
Enter one product. Everything below is computed from your inputs; nothing is pulled from your store.
Per-SKU contribution margin and break-even ROAS
Any currency. Returns are assumed to refund the price and cost you the shipping and fees.
Computed from your inputs. Datadrew does not ingest COGS; the margins Drew works with are the ones you share with it. Per-product ROAS is an approximate split.
How Drew fits. Share your margin bands with Drew and ask which products can afford the next budget increase. Its budget recommendations weigh the margins you share, stock cover and repeat behaviour, not platform ROAS alone, and Drew knows the Shopify business behind the ads: orders, inventory by variant, and cohort repeat by first product, next to Meta and Google spend, refreshed daily. Finding the SKUs sitting below break-even is an analysis you run or ask Drew to run against the bands you have shared; it is not a sweep Drew runs on its own, and Drew does not compute your contribution margin from COGS it doesn't hold. Per-product spend is an approximate split, and Drew says so when it shows it. The wider view is in Product Intelligence.
To see it on your own catalog, pricing is published and flat and the free plan doesn't need a card.
Key Takeaway
ROAS is a revenue multiple. What you keep is contribution margin: CM1 after landed COGS, CM2 after fulfilment, fees and returns, CM3 after ad cost. Break-even ROAS is price ÷ CM2, a per-product number, because a 4x account can hide a 21%-margin SKU losing money on every order. Before any budget increase, run the readiness check with economics first, then conversion volume, time since the last edit, stock cover, new-customer share and the marginal read. The same ROAS on four products can mean scale, stop, wait for the cohort, or don't strand the budget. If a product fails the check, no increase is the decision.
FAQ
Walk me through contribution margin for a Shopify store. What am I forgetting?
Start with net revenue after the discount actually applied, then go down the ladder. CM1: subtract landed COGS (product plus freight and duty). CM2: subtract fulfilment per order (postage, 3PL pick-pack, packaging), payment and platform fees (about 2.9% + 30¢ on Shopify Payments), and expected returns cost (refund plus shipping both ways, weighted by your return rate). CM3: subtract the ad cost of the order. The lines people forget: the discount coming off the top, the return label, the shipping subsidy, and fees charged on the net price. Do it per product or per margin band, not just for the store.
How do I track contribution margin per order on Shopify?
Fill in cost per item on every variant so Shopify's profit-margin-by-order report gives you CM1 per order. Add the CM2 lines Shopify does not hold per order: 3PL and carrier cost for fulfilment, the processing fee from the finance reports, and a return-rate allowance. Ad cost per order has no clean join; use spend per product from the platforms' catalog reports as an approximation and keep CM3 at product level. One sheet with those columns, refreshed weekly, is enough for the scaling decision.
What contribution margin do I need before increasing ad budget?
Enough that the products the increase will sell clear their break-even ROAS (price ÷ CM2) at the ROAS the account actually runs at, with room for the marginal figure to fall as you scale. At 40% CM2, break-even is 2.5x; if the account runs at 3x and the last budget step earned 2.2x, the increase does not pass. Bloom's cited rule of thumb is CM2 above 50% comfortable, below 30% risky. Margin is the first gate; stock cover, new-customer share and the marginal trend follow it.
Is ROAS or contribution margin more important?
Margin decides what ROAS means. A 4x ROAS is excellent at 60% CM2 (break-even 1.67x) and a loss at 20% CM2 (break-even 5x). Use platform ROAS for direction inside a channel and blended ROAS on Shopify revenue for whether the business is efficient, but let per-product CM2 decide where the next budget increase goes.
My ROAS is good but I'm losing money. Why?
Usually one of three things. Returning customers are inside the "conversions", so the ads are being credited for revenue that would have arrived anyway (Howland's client had a 35% new-customer ratio). Or the spend is landing on low-margin products whose break-even sits above the ROAS you are hitting. Or discounts, returns and fees have pushed CM2 well below the number in your head. Compute contribution margin per product and the answer is usually in the table.
What is break-even ROAS and how do I calculate it per product?
Break-even ROAS is the return on ad spend at which an order's CM2 exactly covers the ad cost that produced it: price ÷ CM2 per unit, which is the same as 1 ÷ CM2 %. Calculate CM2 per product from net price, landed COGS, shipping and fulfilment, fees and returns, then divide. A 43.4% margin product breaks even at 2.30x; a 21% margin product at 4.76x. The calculator above does it for one SKU at a time.
Should I keep advertising a product that is below break-even on the first order?
Only as a deliberate acquisition subsidy with a measured payback: customers whose first order is that product repeat strongly enough that the 90-day cohort covers the first-order loss. Measure it at product and cohort level from Shopify orders, never per campaign or per ad, and set a floor on how far below break-even you will go (say, no worse than 0.5x under) and for how long (one cohort window).
Written by Sumit Bansal, co-founder of Datadrew. Published 3 September 2026, updated 7 September 2026 with the CM1/CM2/CM3 ladder and figures. Quotes are linked to their sources inline. Margins in Datadrew are the ones a merchant shares; we don't compute contribution margin from COGS, and we don't claim campaign-level LTV or CAC.