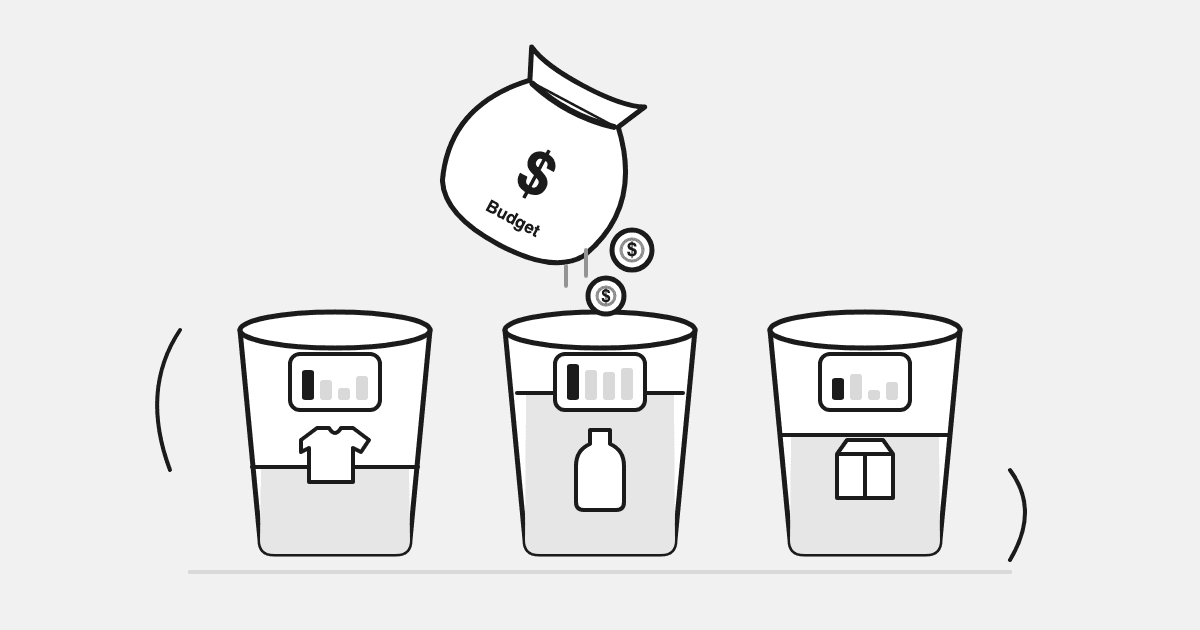
Last month, one Shopify brand's best product bucket ran at about 9x ROAS and got roughly 2% of spend. A bucket barely above 1x was still funded. Meta and Google together claimed about 15% more revenue than Shopify booked. That is what allocating by campaign ROAS does. Bucket-first allocation fixes it: score every product bucket on four inputs, set bucket totals, then hand them down to campaigns.
These numbers come from one planning session with one Shopify brand, surfaced by Drew, DataDrew's AI ads agent, when the brand uploaded next month's unit plan and asked how to split spend. Your buckets will differ. The four-input score transfers.
Every budget guide splits money by funnel stage, platform, or 70/20/10. That is the second decision. The first is which products the money should sell. A brand with a few hundred SKUs does not have one ROAS. It has a hero line at 5x, a growth line at 4x, a replenishment line at 9x because it barely gets spend, a new collection with no history, and a clearance pool you should never scale.
TL;DR
- The finding: a 9x bucket on about 2% of spend, a 1x bucket still funded, legacy campaigns eating close to 10% of budget at under 3x inside a mid-4x account, and about a quarter of planned units on broken-size SKUs. None of it shows in a campaign view.
- The fix: score every bucket on efficiency, unit share required, availability in full size runs, and history.
- Spend share should not equal unit share. The hero bucket carried roughly 40% of units and got a bit less in spend because a quarter of its units were on broken sizes.
- High ROAS at low spend is a warning, not a green light. Feed those buckets in 10 to 15% steps.
- Harvest pools never get scaled. Cap them at around 1.5% of spend.
- Move no more than 10 to 15% of budget between buckets per week, graded on blended MER from Shopify revenue.
What is a product bucket, and why allocate by it?
A product bucket is a group of SKUs that share a commercial job, a margin profile, and an inventory status: hero evergreen, growth, new product development, replenishment, aged stock, liquidation. Most brands already have them in a spreadsheet.
ROAS belongs to the bucket, not the campaign. The same creative converts differently pointed at a hero SKU with every size in stock versus an aged SKU with two sizes left. Campaign totals average that out.
This brand ran about ten buckets. The shape of it, rounded:
| Bucket type | Share of spend | Bucket ROAS | Share of next month's units |
|---|---|---|---|
| Hero evergreen | 40–45% | ~5x | ~40% |
| Growth and seasonal lines | 15–20% | 4–6x | ~20% |
| Replenishment | ~2% | ~9x | ~5% |
| Experimental line | ~1% | ~1x | <1% |
| New collection (unlaunched) | 0% | none | ~15% |
| Harvest pools (aged, liquidation) | ~10% | high but irrelevant | ~5% |
What we found in one account
- Over 40% of spend went to a ~5x hero bucket. Healthy.
- About 2% of spend went to a ~9x replenishment bucket. The most efficient bucket was the most starved.
- Close to 10% of spend sat in old catalog campaigns under 3x, inside a mid-4x account. Nobody had noticed.
Also invisible in a campaign view: about 15% of next month's units sat in a collection never advertised, and about a quarter of planned units sat on products broken on size.
Step 1: Start from the unit plan, not the ROAS report
Next month's budget has a job, measured in units, not ROAS. Sorting last month's campaigns by ROAS tells you where last month's budget worked, not where next month's should go.
Write the job down in three lines:
- Units required, by bucket.
- MER floor the plan must hold. Breakeven MER is 1 ÷ contribution margin percent (the cut-or-feed guide works it through).
- Total performance budget, with awareness spend kept outside it. Mix it in and every bucket looks worse than it is.
Step 2: Score each bucket on the four-input score
The four-input score replaces "sort by ROAS" with four numbers per bucket. This brand's replenishment bucket scored highest on efficiency at about 9x and lowest on history, because it earned that ROAS on about 2% of spend.
Input 1: Bucket efficiency (last 30 to 60 days)
Shopify gross sales for the bucket's SKUs divided by the ad spend pointed at them. Use Shopify revenue. Meta and Google together claimed about 15% more revenue than Shopify booked for this brand, which is normal double-counting. Platform-reported ROAS is a diagnostic number, not an absolute one.
Input 2: Unit share required
The fraction of next month's planned units in the bucket. It stops you starving a bucket the business needs. Hero evergreen was roughly 40% of planned units here, so it could not drop to 20% of spend because a smaller bucket had a prettier ROAS.
Input 3: Availability, in full size runs
Core sizes in stock, not "listed on the site". A hero product with 40% of sizes sold out burns spend on visitors who bounce at the size selector.
About a quarter of this brand's planned units sat on products broken on size. Ignore this and you over-fund the hero bucket by a quarter.
The rule: pull broken products from scaling sets, reinstate them when core sizes are back, and treat unverified new products as broken until proven otherwise. Check at variant level. Product-level stock hides a bestseller with most of its sizes at zero.
Input 4: History (can this bucket actually be scaled?)
Does the bucket have 60 days of stable spend and stable ROAS behind it? If yes, it can absorb an increase. If not, it gets a test pool with a release schedule (Step 4). The 9x replenishment bucket failed this input.
Step 3: Set the allocation (spend share ≠ unit share)
With four scores per bucket, the allocation writes itself, and it will not match unit share. Every deviation needs a named reason:
| Bucket | Unit share | Spend share | Why they differ |
|---|---|---|---|
| Hero evergreen | ~40% | a few points below | A quarter of its units are on broken SKUs |
| New collection | ~15% | ~15% | No history: phased test pool, not a lump |
| Growth line | ~10% | a bit above | Designated growth bucket, mid-4x with headroom |
| Replenishment | ~5% | ~5% | ~9x, but from tiny spend: increase gradually |
| Secondary category | ~2% | ~2x its unit share | 6–7x with stock inbound |
| Harvest pools | ~5% | ~1.5% | Exit inventory; never scale |
No named reason means it is a guess.
How this maps to 70/20/10
Bucket-first allocation lands close to 70/20/10, but from the product side. Proven buckets took about 60 to 65% of this plan. Growth buckets about 15%. Test pools about 15%. Capped harvest and sale pools the rest. Every point is attached to specific SKUs with known stock.
The bucket that dies when you feed it
A bucket showing 9x ROAS at 2% of spend is usually 9x because it is at 2% of spend. The instinct is to triple it. Don't.
At 2% of spend, the bucket catches the warmest demand: existing customers restocking, people who already searched for it. Triple the budget and the next dollar goes to colder traffic at maybe 3x, not 9x. That is marginal return versus average return. The question is not "which bucket has the best ROAS?" It is "where does the next $1,000 earn the most?"
| Bucket | Spend share | Average ROAS | Likely ROAS on the next $1,000 | Action |
|---|---|---|---|---|
| Hero evergreen | ~40% | ~5x | a little under 5x | Increase, stock permitting |
| Growth line | ~10% | ~4x | ~4x | Increase |
| Replenishment | ~2% | ~9x | 3–5x, unknown | Increase in 10–15% steps, re-read after each |
| Experimental line | ~1% | ~1x | n/a | Learning pool, not graded on ROAS yet |
Direction, not decimal.
The rule: buckets that earned their efficiency at low spend get their increase in 10 to 15% steps every three or four days, with MER re-read after each step. When marginal MER nears the floor, stop. The experimental line at about 1x is the reverse case: a learning pool, not a failure to cut.
Harvest pools: the buckets you never scale
Harvest pools are base, aged, and liquidation inventory. They get a fixed allocation that does not rise with ROAS. This brand capped them at around 1.5% of spend.
Deep discounts convert, so these pools show great ROAS. But you are selling inventory you already wrote down, to customers who would have bought anyway, at a margin that may be negative after the discount. Scaling a harvest pool speeds up liquidation. It does not build the business. Grade harvest pools on margin. ROAS is the wrong number for this decision.
Step 4: The new collection gets a phased pool, not a lump
A collection with no ad history gets a test pool released in phases, not its full unit share on day one. This brand's new collection was about 15% of planned units and took about the same share of Meta spend over 30 days. All of it on day one would have spread learning across a couple of hundred products, most not yet in the warehouse.
| Window | Budget released | Rule |
|---|---|---|
| Days 1–3 | ~20% of the pool | Only products physically received with full size runs |
| Days 4–7 | ~25% | Promote winning product families, not the whole collection |
| Days 8–14 | ~25% | Scale products with Shopify MER at or above the floor |
| Days 15–30 | ~30% | Reallocate toward proven winners |
MER above the floor: increase 10 to 15% every three days. A little under: hold and fix creative or the product page. Well under: stop scaling. No winner/loser verdict in the first 72 hours unless availability or tracking is clearly broken.
How the launch actually went is in Launching a New Collection on Paid Ads: The Phased-Release Playbook.
Step 5: Find the drag hiding inside a healthy account
A healthy account average hides weak pockets. This brand ran at mid-4x blended. A few old catalog campaigns inside it spent close to 10% of the month's budget at under 3x.
The three campaigns
A bottom-of-funnel dynamic catalog campaign, an Advantage+ catalog campaign over a year old, and a secondary-category catalog prospecting campaign. All under 3x for weeks. Nobody had noticed, because the account average was fine. The fix was not to kill catalog as a format; other catalog campaigns were working. It was to trim these three by about 20% and move the freed budget into the new collection's prospecting pool.
How to find yours
Monthly, list every campaign below your MER floor for two or more weeks running and ask which bucket each one really funds. Most drag lives in old catalog campaigns pointed at broad or aged product sets. The cut-or-feed thresholds apply here too.
The weekly operating cadence
Bucket-first allocation is a monthly plan with a weekly correction loop:
- Monday: set bucket-level spend limits for the week.
- Daily: remove broken or unavailable products from scaling sets. Check yesterday's top-spending ads against live inventory.
- Every three days: compare actual spend share, units sold, and Shopify MER per bucket against plan.
- Weekly: move no more than 10 to 15% of budget between buckets.
- Transfer priority when a bucket underdelivers: hero first, then seasonal, then growth, then replenishment.
- Never scale harvest pools on the strength of their ROAS.
If a bucket's MER drops mid-week, run the daily root-cause check before moving budget. A stockout or a fatigued creative is not an allocation problem. Moving budget away from it just moves the symptom.
Step 2 is the one that slips. Drew runs it as an early-morning snapshot, so broken SKUs leave the scaling sets before the day's spend starts.
What this costs you if you do it by hand
Bucket-first allocation joins four datasets: Shopify orders by SKU, ad spend by campaign and product set, live inventory by variant, and your bucket mapping. Most brands have all four and nowhere to join them. By hand it takes a day or two of analyst time per month. So it gets done once a quarter, if at all, and the weekly loop never happens.
Doing this without a spreadsheet
This brand built the plan in one conversation with Drew, DataDrew's AI ads agent. It uploaded next month's unit workbook and asked how to split spend by bucket. Drew joined the workbook with Shopify product sales and ad spend from both platforms, and returned the bucket allocation table, the broken-stock exposure, the catalog campaigns under 3x, and an operating document for the month. Drew now runs the four-input score on a schedule and flags when a bucket's MER drops below the floor or a scaling set contains a broken SKU. The monthly plan in an afternoon. The weekly loop with no spreadsheet.
FAQ
How do I decide ad budget allocation between campaigns on a fixed budget?
Buckets first, then campaigns. Score each bucket on efficiency, unit share required, availability, and history, set bucket totals, then split each bucket into prospecting, retargeting, and testing. This brand landed at roughly 60 to 65% proven, 15% growth, 15% test, and a small capped slice for harvest. Campaign-level rules: the cut-or-feed guide.
Should ad spend share match product unit share?
No. Unit share is one of four inputs. This brand's hero bucket carried roughly 40% of units and got a few points less in spend because a quarter of its units were on broken sizes.
How do I allocate budget to a product that has never been advertised?
Give it a fixed test pool released in phases gated on Shopify MER: roughly 20 / 25 / 25 / 30% over 30 days, with no winner/loser call in the first 72 hours.
Why not just fund the highest-ROAS bucket?
ROAS earned at low spend does not survive high spend. This brand's ~9x bucket ran on about 2% of spend, so it was scaled in 10 to 15% steps with MER re-read after each one.
How often should I rebalance budget between buckets?
Weekly, moving no more than 10 to 15% of total budget. Daily for pulling broken products from scaling sets. Monthly for the full re-plan. Bigger weekly moves reset learning underneath.
Should clearance or aged inventory get more budget when its ROAS is high?
No. Harvest pools get a small fixed allocation, around 1.5% of spend. Their ROAS is high because of discounting and warm demand. Scaling them speeds up liquidation without building the business.
What is the difference between bucket allocation and campaign allocation?
Bucket allocation decides which products the money should sell. Campaign allocation then structures spend inside each bucket: prospecting vs retargeting, CBO vs ABO, which creatives. This brand's account averaged mid-4x at campaign level while a few campaigns inside it ran under 3x. Only the bucket view showed it.