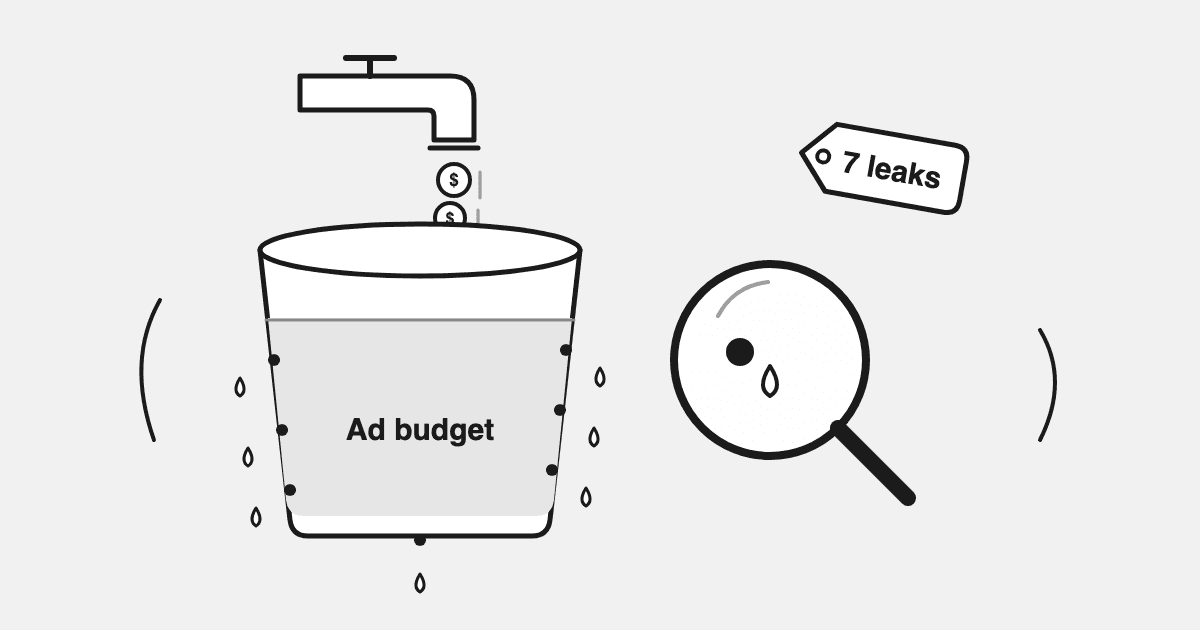
We took one Shopify brand's last 30 days of Meta and Google Ads spend and checked every ad dollar against the store's real orders, stock, and margin. About half of it sat in seven avoidable leaks. The biggest one, spend below break-even ROAS, was about a third of the account on its own.
None of the seven needs a new tool to find. They need the ad data and the Shopify data in the same place, which is the part most brands skip.
TL;DR: the 7 leaks and the share of spend each ate (one brand, 30 days)
| # | Leak | Share of total ad spend |
|---|---|---|
| 1 | Ads for products at zero or negative stock | ~9% (about 1% was pure waste; the rest sold into backorder) |
| 2 | Campaigns and ad sets below break-even ROAS | ~31% |
| 3 | Fatigued creatives still carrying budget | ~3% dead, plus ~40% on winners past their peak |
| 4 | Brand search counted as acquisition | ~6% |
| 5 | Boosted posts with an engagement objective | ~5%, zero purchases |
| 6 | Search terms that never converted | ~7% |
| 7 | Cold ad sets with no purchaser exclusion | up to ~7% |
Leaks overlap, so they do not sum. De-duplicated, roughly half the spend was either pure waste or below break-even. Sample size is one brand. We say so again below.
How we measured this (and what it is not)
This is a 30-day audit of one Shopify brand running Meta and Google Ads. We pulled the ad data and the Shopify data through Datadrew and joined them: product-level ad spend against inventory, campaign ROAS against contribution margin, cold-audience spend against the store's returning-customer share.
It is one account, not a survey. Industry posts quote "30 to 37% of ad spend is wasted" and cite each other. We would rather show you one real account with the math visible than repeat a number nobody can trace. We will re-run this across every connected store as the sample grows.
Two assumptions to know before the numbers:
- Break-even ROAS uses a 60% contribution margin, so the line is 1.67. If your margin is 40%, the line is 2.5 and leak 2 gets bigger.
- Platform ROAS is self-attributed. Meta and Google each grade their own homework. On this account their combined claims covered about 38% of Shopify orders, which is plausible. If yours add up to more than 100% of your orders, fix tracking before you cut anything.
Before the audit: reconcile platform claims with Shopify orders
One check, thirty seconds. Add up the purchases Meta and Google each claim for the month. Compare to Shopify orders for the same dates.
If the platforms claim more orders than the store shipped, you have duplicate pixel events, a Conversions API deduplication problem, or view-through attribution doing the heavy lifting. Every ROAS number below that line is fiction, and cutting campaigns on fiction makes the account worse.
On this account the two platforms together claimed 38% of orders and about half of net sales. That is a sane starting point. The audit that follows assumes yours is too.
Leak 1: you are paying for clicks on products you cannot ship
How to spot it. Pull product-level ad spend from Google Shopping and Performance Max. Join it to Shopify inventory by variant ID. Look at any row where available stock is zero or negative.
What we found. About 9% of total spend went to variants at or below zero stock. Almost all of it was one hero product oversold by more than a thousand units, with "continue selling when out of stock" switched on. It still converted, so it is not pure waste. It is a fulfilment risk: paid customers waiting on backorder, refunds, and a second month of ads for a product you still cannot send.
The pure-waste slice, products at zero stock that produced one conversion or fewer, was about 1% of spend. Small, but it was spread across five products nobody had looked at.
The fix. Decide the rule once: pause ads on any variant under X days of cover, or let hero products sell into backorder but cap the spend. Then check it weekly, because the feed does not check for you. The full method is in Ad Spend on Out-of-Stock Products: The Leak Nobody Watches.
The Drew prompt. "Which products got ad spend in the last 30 days while Shopify stock was zero or negative, and how much did each convert?"
Leak 2: a third of the account ran below break-even ROAS
How to spot it. Work out break-even ROAS from contribution margin: 1 divided by margin. At 60% margin it is 1.67. At 40% it is 2.5. Then list every campaign and ad set by ROAS and draw the line.
What we found. About 31% of spend sat below the line. Three Performance Max campaigns ran at 1.07 to 1.23. Two Meta ad sets ran at 0.79 and 1.37, one of them still in the learning phase after 30 days. Each one looked fine in its own dashboard because nobody had put the margin next to it.
A second cut of the same data: two of the three countries the account shipped to ran below break-even on Google. Together they were about 9% of spend. Country is the fastest place to find a below-break-even bucket because it is one breakdown.
The fix. The line is not "pause everything below it". It is "know what is below it, then decide". Performance Max can be undercounted on the primary conversion action, so check the conversion-action list first. After that, the contribution-margin check every budget increase should pass and marginal ROAS tell you which of these to cut and which to starve.
The Drew prompt. "List every campaign and ad set from the last 30 days with ROAS below my break-even, with spend, and rank by spend."
Leak 3: winners past their peak are eating the budget
How to spot it. Two signals, per ad, not per campaign. Link CTR down 30% or more from its own 7-day peak, with frequency above 2.5. Or the last 7 days' cost per purchase at 1.5 times the ad's own 30-day baseline.
What we found. Seven ads graded dead. They were about 3% of total spend, and six of them were boosted posts (see leak 5). That is the easy part.
The expensive part: seven more ads graded fatiguing. Their ROAS still cleared the line, so nobody touched them. But their last-7-day cost per purchase ran 1.7 to 3.5 times their own baseline, and four of them had lost 26% to 59% of their link CTR from peak. Those seven ads carried about three quarters of Meta spend, roughly 40% of the account. The account's average frequency was 5.
The fix. Dead means kill. Fatiguing with ROAS intact means the concept works and the execution is tired, so brief the next iteration now, not when ROAS finally breaks. The thresholds and how to read them are in Ad Creative Fatigue: Signals, Thresholds, and Real Cost, and the five things that look like fatigue but are not are in Winning Facebook Ad Stopped Working?.
The Drew prompt. "Grade every Meta creative from the last 30 days as scale, iterate, kill or wait, and show the last-7-day CPA against each ad's own baseline."
Leak 4: brand search is being counted as acquisition
How to spot it. Open the search terms report. Flag every term that contains your brand name or a misspelling of it. Sum the spend. Then look at which campaigns it sits in.
What we found. About 41% of the sampled search-term spend was brand terms, roughly 6% of total spend. The interesting part was where it lived. The campaign named as the brand campaign was less than half brand traffic. It also bought "vitamin c", "5 minoxidil" and generic product terms. The shopping campaign, which nobody thought of as brand, was half brand traffic. So the brand ROAS was understated and the shopping ROAS was flattered, and both budgets were being set on the wrong number.
The fix. Split brand from non-brand at the campaign level and use Performance Max brand exclusions. Report blended ROAS with and without brand. Brand spend is not waste. Counting it as new-customer acquisition is.
The Drew prompt. "Split last month's Google spend into brand and non-brand terms per campaign, and show ROAS for each half."
Leak 5: boosted posts with an engagement objective
How to spot it. Filter Meta campaigns by optimisation goal. Anything set to engagement, profile visits or an automatic objective is a boosted post, not an ad.
What we found. Seventeen boosted posts spent about 5% of total spend in 30 days and produced zero purchases. Another ninety-odd boosted-post ad sets were still switched on with no spend, waiting for the next boost. Six of the seven ads the fatigue grader called dead were in this group.
Boosted posts are cheap per post and nobody owns the total. That is how 5% of the budget ends up with no conversion objective.
The fix. Boost from an ads account with a purchase objective, or do not boost. If a post earns organic engagement, turn it into a conversion ad in the main campaign so it gets a purchase-optimised audience.
The Drew prompt. "Which Meta campaigns from the last 30 days had no purchase objective, how much did they spend, and how many purchases did they produce?"
Leak 6: search terms that never converted
How to spot it. Search terms report, last 30 days, sorted by cost. Filter conversions to zero.
What we found. In the top 400 terms by cost, 313 had zero conversions. They were nearly half of the sampled search-term spend and about 7% of total spend. The top offenders were generic competitor-category terms ("hair gummies", "vegan multivitamin", a competing active ingredient) and, uncomfortably, a couple of brand-plus-"reviews" terms. Some of these overlap with leak 4.
Shopping products with zero conversions added under 1%. The waste is in search terms, not the feed.
The fix. Weekly negatives, not monthly. Cross-check against converting terms first so you do not negative a term that converts in a different campaign. The rule of thumb: a term that spent three times your cost per purchase with no purchase goes on the list.
The Drew prompt. "Show me search terms from the last 30 days that spent more than 3x my cost per purchase with zero conversions, and check whether any of them converted in another campaign."
Leak 7: cold ad sets with no purchaser exclusion
How to spot it. For every cold-audience ad set, open targeting and look for an excluded audience of recent purchasers. Then pull the store's returning-customer share of orders from Shopify.
What we found. Of the three cold conversion ad sets, one excluded purchasers from the last 90 days. Two did not. Those two carried about 20% of total spend. On the Shopify side, returning customers were 38% of the month's orders.
You cannot see from Meta how much of that cold spend hit existing customers. You can bound it: at the store's returning share, up to about 7% of total spend was paying to reach people who already buy. The true number is lower because not every returning customer arrives through an ad, but it is not zero, and a subscription product makes it worse.
The fix. Sync a Shopify purchasers audience to Meta and exclude it from every cold ad set, with a 60 to 90 day window. Retarget existing customers on purpose, in their own ad set, with a replenishment message and a smaller budget.
The Drew prompt. "Which of my cold Meta ad sets have no purchaser exclusion, what did they spend, and what share of last month's Shopify orders came from returning customers?"
What did not turn out to be a leak
Two places we expected waste and found none, so you can skip them first pass.
- Hour of day. The overnight hours on Google spent little and converted fine.
- Placements. The long tail of Meta placements (search, notifications, marketplace, right column) spent a fraction of a percent. Stories, feed and reels did the work and all cleared break-even.
Run the audit yourself in 10 minutes
Install Datadrew on the store (free) and connect Meta and Google inside it: apps.shopify.com/customer-lifetime-value. Add the connector in Claude (mcp.datadrew.io/mcp) or ask Drew in the app, then run the seven prompts in order:
- "Which products got ad spend in the last 30 days while Shopify stock was zero or negative?"
- "List every campaign and ad set with ROAS below my break-even, ranked by spend." (Tell it your margin.)
- "Grade every Meta creative as scale, iterate, kill or wait."
- "Split Google spend into brand and non-brand terms per campaign."
- "Which Meta campaigns had no purchase objective, and what did they spend?"
- "Which search terms spent more than 3x my cost per purchase with zero conversions?"
- "Which cold ad sets have no purchaser exclusion, and what share of orders are returning customers?"
Or skip the prompts: the free leakage audit runs the same seven checks on your account and sends the numbers back.
The order matters. Leak 2 is the biggest, but leaks 4 and 6 change what leak 2 says, and leak 1 changes which campaigns you are allowed to scale afterwards. Run all seven, then decide.
FAQ
How much ad spend is wasted on average?
Published estimates range from 20% to 40% and mostly cite each other. On the one Shopify account we audited, roughly half of 30-day spend was either pure waste or below break-even ROAS once margin was applied. The single biggest bucket was below-break-even campaigns at about a third.
What is the fastest leak to find?
Zero-conversion search terms. One report, one filter, ten minutes. On this account it was about 7% of spend.
Should I pause everything below break-even ROAS?
No. First confirm the conversion action is not undercounting (Performance Max is the usual suspect), then separate brand from non-brand. What is left below the line is a real decision, and marginal ROAS tells you which of those to cut first.
How often should I run this audit?
Search terms and out-of-stock products weekly. Creative fatigue weekly. The break-even and purchaser-exclusion checks monthly, or any time you change margin, pricing or audiences.
Does this apply to Google-only or Meta-only accounts?
Yes. Leaks 1, 2, 4 and 6 are mostly Google. Leaks 3, 5 and 7 are mostly Meta. Leak 2 applies to both.
---
Method note: one Shopify brand, Meta and Google Ads, 30 days ending mid-September 2026. Ad data and Shopify data pulled through Datadrew. Figures rounded. Break-even ROAS assumes a 60% contribution margin. We will republish with a range once the audit has run across more connected stores.