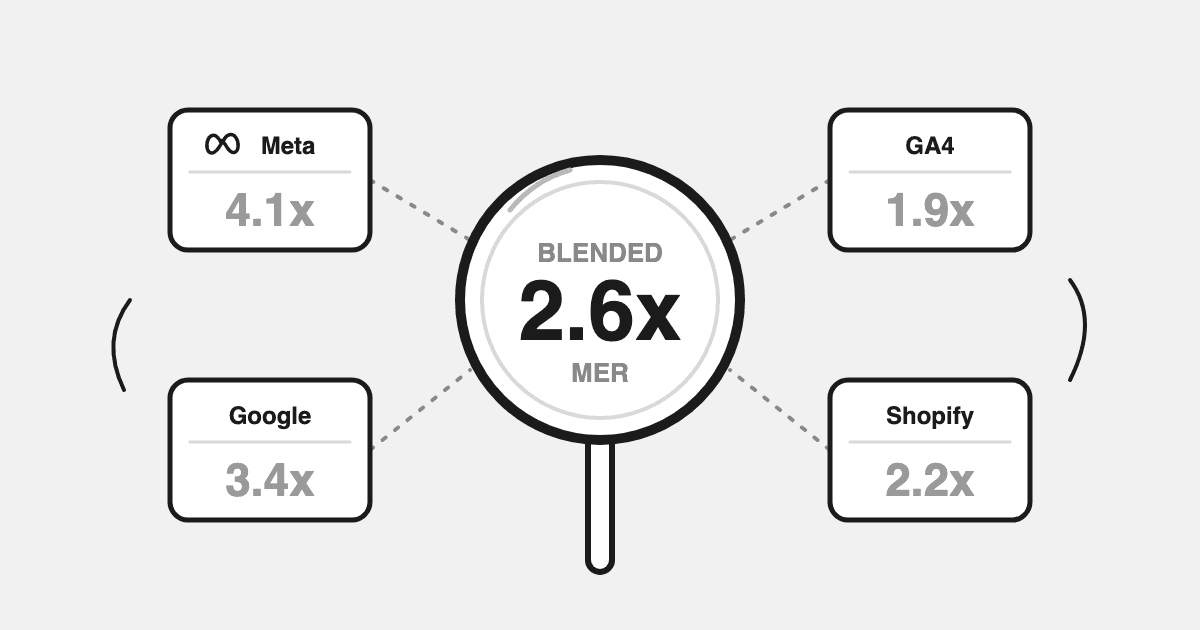
The one ROAS number you can fully trust is blended ROAS — total store revenue divided by total marketing spend, also called MER. Every Shopify brand tracks ROAS, and almost every brand tracks a number it should not fully trust. Meta reports one figure, Google another, GA4 a third, and none of them match what Shopify actually recorded. The fix is not a better attribution model. It is a simpler question: for every dollar you spend on marketing, how much revenue does the business actually make?
Key Takeaways
- Platform ROAS numbers disagree with each other and with your store, by design: each platform measures with its own rules and windows.
- Blended ROAS (total revenue ÷ total ad spend), also called MER, is the one efficiency number that cannot be gamed.
- Your minimum viable blended ROAS comes from your margins: at 25% allowable marketing cost, you need 4:1.
- Watch how blended ROAS moves when spend changes; that reaction is your budget signal.
- Not all revenue is equal: cohort and product-level LTV tells you which revenue is worth paying more for.
Why Your ROAS Numbers Don't Match
Pull up Meta Ads Manager, Google Ads, GA4, and Shopify for the same week and you will see four different revenue totals. This is not a bug in your setup. Each platform counts with its own rules: different conversion windows, different definitions of a conversion, different handling of view-through and cross-device behavior.
The practical consequence: you cannot simply add platform-reported revenues together. The sum will exceed what your store actually made, sometimes by a wide margin. Any budget decision made on top of that sum inherits the distortion.
The way out is to anchor every efficiency question to one source of truth, the revenue your store actually recorded, and to treat platform-reported figures as directional signals about activity inside each platform, not as claims on your revenue.
| Number | How it's counted | What it's good for |
|---|---|---|
| Meta ROAS | Meta-attributed conversions, Meta's windows (incl. view-through) | Comparing campaigns and creatives inside Meta |
| Google ROAS | Google-attributed conversions, Google's windows | Comparing campaigns and keywords inside Google |
| GA4 revenue | Last-click-leaning model across sessions it can see | Directional cross-channel comparison |
| Blended ROAS (MER) | Actual Shopify revenue ÷ total ad spend | Budget decisions and business-level efficiency |
Blended ROAS: The Number You Can Trust
The most reliable way to measure marketing efficiency at the business level is blended ROAS, also called Marketing Efficiency Ratio (MER). The formula is simple: total store revenue divided by total marketing spend. No models, no channel math, no complexity.
If your blended ROAS is 4:1, your overall marketing engine generates $4 of real revenue for every $1 spent. It cannot be inflated by measurement quirks because both inputs are hard numbers: what you spent, and what the store sold.
Setting Your Blended ROAS Target
Your target depends on gross margin, operating costs, and growth stage. A brand with 70% gross margins can operate profitably at 3:1; a brand at 40% margins may need 5:1 or more.
To find your minimum viable blended ROAS: work out what percentage of revenue you can spend on marketing while still covering COGS, opex, and your target profit. If that is 25%, your floor is 4:1 (1 ÷ 0.25). Growth-stage brands often run below their long-term target deliberately, spending into market share while customer lifetime value catches up. That is a fine strategy, if it is a decision and not an accident.
Reading Blended ROAS When Spend Changes
Blended ROAS becomes a decision tool the moment you watch how it reacts to spend.
Increase Meta spend by $10,000 for two weeks. If blended ROAS holds at 4:1, the added spend is pulling its weight. If it slides to 3.5:1, the incremental dollars are dilutive, and you have found the edge of that channel's efficiency at current creative and audience. The same works in reverse: cut spend and watch whether revenue falls proportionally.
Two rules make this readable. Change one thing at a time, and hold the change long enough to cover a full purchase cycle (for most Shopify brands, at least two weeks). For the full mechanics, see how to calculate blended ROAS across Meta, Google & Shopify, and for where the metric stops helping, what blended ROAS can't tell you.
Split New From Returning Before You Judge Anything
One refinement makes blended ROAS dramatically more honest: separate new-customer revenue from returning-customer revenue.
Returning customers buy because of work you did months ago: the product, the post-purchase experience, the email flows. When this quarter's ad spend gets graded against revenue your retention engine produced, efficiency looks better than it is. Compute acquisition MER (ad spend against new-customer revenue only) alongside blended ROAS, and you will know whether ads are actually acquiring, or coasting on retention.
Not All Revenue Is Equal: The LTV Context
Blended ROAS treats every revenue dollar the same. Your business should not. A first order from a customer who will buy five more times is worth far more than the same order from a one-time buyer, and you can see that difference without any channel-credit math.
Track LTV by cohort and by first product purchased. Some products consistently start high-repeat relationships; others sell well once and end there. Our product intelligence guide covers how to find those gateway products, and the cohort analysis guide shows how to read the curves. Feed the winners in your merchandising and offers, and let your blended target account for the repeat revenue they bring.
Common ROAS Mistakes to Avoid
- Adding platform revenues together. They overlap; the total will exceed reality.
- Judging efficiency on platform ROAS alone. Use it to compare campaigns inside one platform, not to allocate budget across platforms.
- Ignoring margins. A 4:1 ROAS on a 30%-margin product loses money. Efficiency targets belong on profit, not revenue.
- Reading daily noise as trend. Blended ROAS is a weekly-and-longer metric; daily wobbles are mostly timing.
- Never splitting new vs returning. The single most common way brands overestimate their acquisition efficiency.
A Measurement Stack That Stays Honest
You need three layers, and they are simpler than most stacks: spend from every platform in one place, revenue reconciled to actual Shopify orders (refunds included), and blended metrics computed on top with consistent definitions.
Datadrew does this overnight for 15+ sources, and you can question the result in plain language: in-app with Drew AI, or inside Claude through the Datadrew MCP ("what's my blended ROAS this week, and how does it split new vs returning?").
FAQ
What is a good ROAS for a Shopify store?
It depends on gross margin. Calculate the share of revenue you can spend on marketing while staying profitable; the inverse is your minimum blended ROAS. At 25% allowable marketing cost, that is 4:1. Judge against blended ROAS, not any single platform's number.
Why is my Meta ROAS different from Shopify revenue?
Each platform counts conversions with its own windows and rules, so platform-reported revenue will not match store-recorded revenue. Treat platform ROAS as an in-platform signal and anchor decisions to blended ROAS against real Shopify revenue.
What is the difference between ROAS and MER?
MER (Marketing Efficiency Ratio) is blended ROAS: total revenue divided by total marketing spend across all channels. Platform ROAS measures one platform's reported results; MER measures the whole business.
How do I track blended ROAS automatically?
Datadrew reconciles spend from Meta, Google, and other channels against actual Shopify orders overnight and serves blended ROAS and MER at store and product level, queryable in plain language via Drew AI or the MCP in Claude.
See your blended ROAS on real store data: start free with Datadrew.