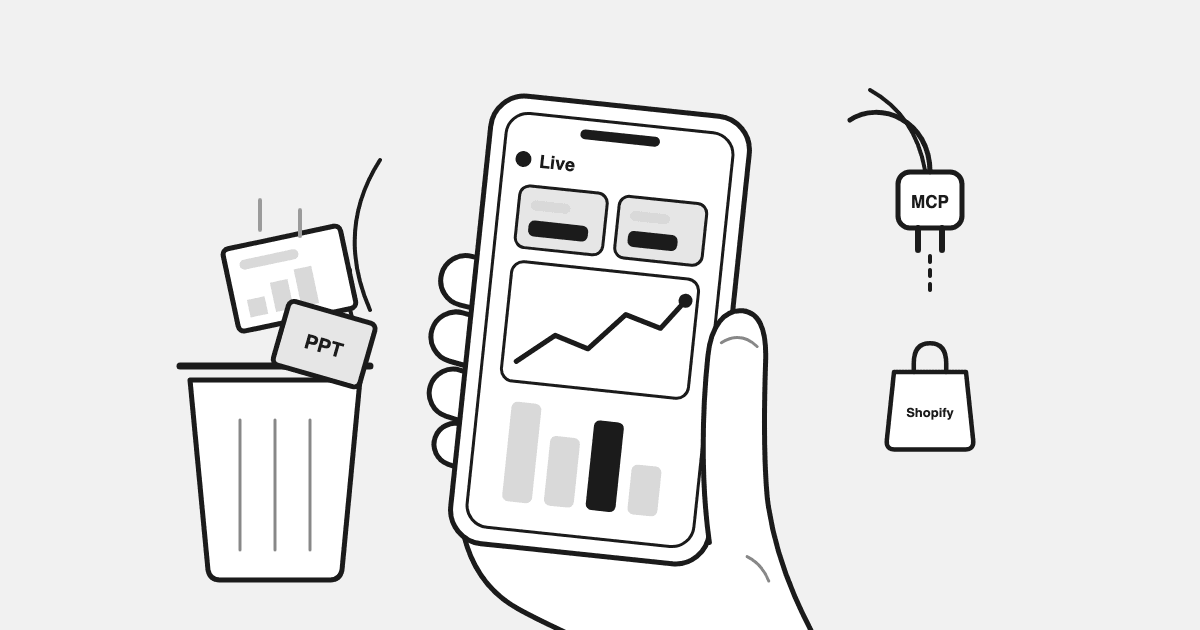
Reporting week is a tax every Shopify agency pays: export CSVs from Meta, Google, and Shopify, screenshot Ads Manager, rebuild the deck, and repeat it for every client. There is now a way to stop paying it. Connect each client’s store and ad accounts once through MCP, and the dashboard becomes something you ask for, not something you assemble. This post walks through how that works, what it replaces, and where its limits are.
TL;DR
- The old reporting way (export, screenshot, rebuild the deck, repeat per client) costs a morning per client and is stale before the client opens it.
- Reporting tools automate the assembly but not the answers: a template answers last week’s questions, and every new client question sends you back to exports.
- MCP flips the model: connect each client’s store + ad accounts once, then Claude reads the live data and builds the dashboard from a prompt.
- One prompt gives you every client’s health in one view: revenue, spend, blended ROAS, and a flag on who needs attention today.
- Setup is ~10 minutes per client account, and each client stays an isolated, permissioned connection.
What the Old Way Actually Costs
Write down the reporting ledger for one client for one week and it looks like this:
- Export campaign data from Meta Ads Manager. Export again from Google Ads. Pull Shopify revenue separately.
- Join them in a spreadsheet so platform ROAS and real revenue sit in the same row.
- Screenshot the charts. Paste into the deck. Update the commentary.
- Answer the follow-up email (“why did ROAS dip on Tuesday?”) by doing half of it again.
Call it a morning per client. At ten clients, reporting is a full-time job that produces documents which are stale the moment they’re sent. And the stale part matters more than the slow part: the client’s question is always about today, and the deck is always about last week.
Reporting Tools Automate the Assembly, Not the Answers
The standard fix is a reporting platform: connect the accounts, pick a template, schedule the send. That genuinely kills the export-and-paste step, and for a pure “send the client a branded PDF on Mondays” workflow it’s fine.
But a template is a frozen set of questions. The dashboard shows spend, ROAS, and revenue because that’s what you configured in January. When the client asks something the template didn’t anticipate (“which creatives died last week?”, “is retargeting cannibalizing organic?”), you’re back in exports. You’ve automated the report and kept the analysis manual, and the analysis was the expensive part. We compared the main dashboard options in our Triple Whale alternatives breakdown; the honest summary is that they all show numbers on their schedule, not answers on yours.
What an MCP Is, in Agency Terms
MCP (Model Context Protocol) is the open standard that lets an AI assistant like Claude read live data from other systems. Instead of you exporting data to the AI, the AI queries the source directly: this hour’s spend, today’s revenue, the current state of every campaign.
For an agency, the practical meaning is one sentence: connect a client’s Shopify store and ad accounts once, and from then on you ask questions instead of building reports. If you want the deeper technical picture, we’ve explained which Shopify MCP server does what.
Live Dashboards, Built by a Prompt Instead of a Template
Here’s the part that replaces the deck. With the data connected, you ask Claude for the dashboard you want:
“Build me a dashboard for this client: last 30 days of Meta and Google spend against Shopify revenue, blended ROAS trend, top campaigns, and the three things that changed most this week.”
Claude queries the live data and renders the dashboard on the spot: charts, tables, commentary. Change your mind about what belongs on it, and you say so in plain English instead of reconfiguring widgets. Next week you don’t update it; you ask for it again and the numbers are current. We’ve documented the single-store version step by step in how to connect Shopify to Claude and build a live dashboard.
The One-View Version: Every Client’s Health at Once
The agency-specific prompt is the roster view:
“Across all my client accounts: revenue, spend, and blended ROAS versus last week, and flag anyone whose numbers moved more than 15%.”
That’s the “who needs me today?” screen agencies keep trying to build in spreadsheets: one row per client, a trend arrow, and a flag. Because each client’s Datadrew connection joins their ad spend to their real store revenue, the flags fire on numbers that survive a client call, not platform-reported ROAS. (Why that distinction matters: blended ROAS, and what it can’t tell you.)
What This Looks Like in the Wild: Two Real Setups
Both of these are real Datadrew accounts; details are shared with permission and lightly anonymized.
The Agency That Was Already Doing It the Hard Way
A performance lead at an agency running 8–10 Shopify client accounts (Meta + Google) told us he was already “using AI for reporting.” His version: screenshot Ads Manager, export the sheets, paste it all into Claude, and ask what changed. Smart instinct, wrong plumbing — the AI only ever saw what he remembered to paste.
His Monday ritual was the classic one: a Google Sheets template rebuilt weekly per client — spend, revenue against projections, ROAS, CPM, CTR, CPC, landing-page views, cart rate, conversion rate, hook and hold rates, frequency — the last 28 days cut into four weekly segments. Every metric hand-carried from three platforms into one sheet.
Once his accounts were connected through MCP, the same Monday output became one prompt — a “Media Buyer Weekly Action Brief” that renders as an HTML report: the week’s numbers against the client’s actual revenue and blended-ROAS targets, plus context Claude assembled itself from the store — top products by revenue, LTV by acquisition cohort, frequently-bought-together pairs, discount depth. Nothing in that list was pasted in. The next thing he scoped with us wasn’t another report — it was the live dashboard version of it.
The Client Who Built Their Own Dashboards
The stronger proof that dashboards-by-prompt is real: one apparel brand’s data analyst built his own. Nobody on our team made these — he asked for them. A discount-anomaly dashboard that flags when coupon behavior goes weird. A codified “brokenness report” that catches size stock-outs on hero SKUs before they silently cap revenue. Strict report definitions with excluded order tags, so every number survives finance review.
Then the team turned their best prompts into shared slash commands — a daily root-cause check, a media-buyer brief, a creative analysis — and usage spread from one analyst to six roles, leadership included. Their daily question is the one no static dashboard answers: revenue dipped — is it a Meta creative problem, a Google feed problem, or an inventory problem? The joined data answers it as a causal story, not a wall of charts.
The Reporting Jobs This Replaces
Each of these was previously an export-and-assemble task. Each is now a prompt:
- The Monday client summary. “What changed last week and why” per client, written from live data before your standup ends.
- The month-end recap. Spend, revenue, ROAS, wins, and the plan, drafted from the actual numbers rather than reconstructed from memory.
- The “why did ROAS dip” investigation. The follow-up email that used to cost an afternoon becomes a two-minute question with the diagnosis attached.
- The wasted-spend audit. “Audit this Meta account for wasted spend, last 30 days” — run it before the client asks, on every account.
- The creative check. Which ads are fatiguing before the ROAS drop shows up, and which concepts deserve budget, graded on purchases instead of CTR.
- The reconciliation argument. Meta says one number, the P&L says another; the blended view ends the debate with both numbers in the same table.
The Setup, Per Client (~10 Minutes)
- Install Datadrew on the client’s store (free) and connect their Meta + Google ad accounts inside it. This is the joined spend-plus-revenue layer everything reads from.
- Add the MCP connector in Claude. Claude → Settings → Connectors → add custom connector:
https://mcp.datadrew.io/mcp. - Grab the prompt library at app.datadrew.io/datadrew-mcp and start with the wasted-spend audit.
Each client is a separate store-level install with its own permissions. Nothing is shared between clients, and offboarding a client is uninstalling an app, not untangling a spreadsheet.
What This Doesn’t Do
- It doesn’t send white-labeled PDFs on a schedule. If a client contractually requires a branded Monday PDF, keep the reporting tool for that artifact and use the MCP layer for the analysis behind it.
- It doesn’t replace judgment. The dashboard flags that a client’s conversion rate fell; deciding what to tell them and when is still your job. More on that split in our guide to AI for Shopify agencies.
- It’s only as good as the connections. A client who won’t grant ad-account access stays a manual client.
FAQ
Can I share the dashboards with clients?
Yes — export or share the outputs Claude produces, or present them live. What you can’t do (yet) is schedule automated branded sends; that’s the one job the old tools still own.
Is client data isolated?
Yes. Each install is scoped to one store and its connected ad accounts. There’s no cross-client pooling, and access is revoked by uninstalling.
Do I need to know how to query data?
No. The prompts are plain English. The library at app.datadrew.io/datadrew-mcp covers the standard agency jobs, and you adapt them by rewording, not by learning a query language.
We already pay for a reporting platform. Rip it out?
Not on day one. Run the MCP layer on your two most reporting-heavy clients for a month. If the ad-hoc questions and the Monday summaries stop touching the reporting tool, you’ll know what to do at renewal.