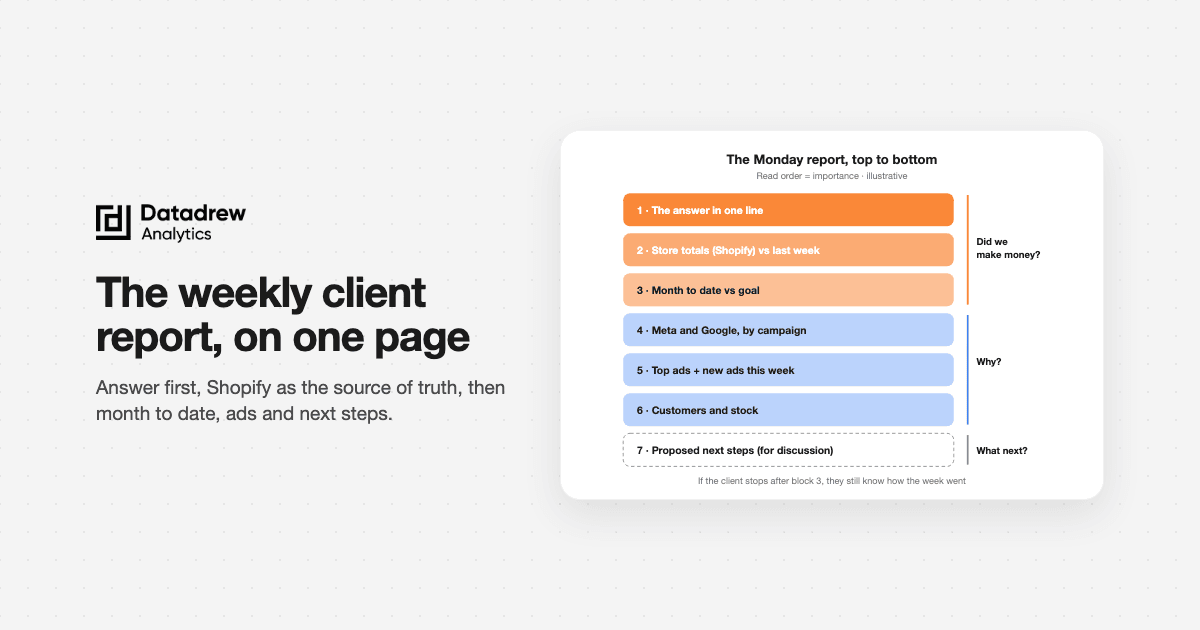
A weekly client report for a Shopify ads agency should answer three questions in the first screen: did the store make more money than last week, which ads (old and new) are doing the work, and what you plan to do next. Take revenue and orders from Shopify. Take spend, clicks and ad-level results from Meta and Google. Never add the platforms' ROAS together, and when the pixel breaks, report the week on Shopify orders and say so plainly.
In the last month, one agency that runs Meta and Google for several Shopify brands asked Drew, DataDrew's AI agent, for this report four times, for three different clients. This post is built from what they asked for, and from what they sent back to fix. The agency and its clients aren't named. Every number in the examples is invented and rounded.
TL;DR
- Lead with three answers, not 40 metrics. Money, ads, next steps. Everything else is an appendix.
- Shopify is the store's total. Platform numbers explain delivery and compare ads with each other. They don't add up to the total, and they aren't meant to.
- Show week-on-week and month to date against a real goal. A month-to-date number without a goal is just a number.
- Give new ads their own section. Clients ask "did the new ads start working?" every week. Answer it before they ask.
- When the pixel breaks, keep the report. Use Shopify orders for results, Meta for spend and clicks, and mark the affected days.
- Watch the date basis. Google counts a conversion on the click date by default, so last week's numbers can still move.
- Write the plan as a proposal. "What we're considering," not "what we will do."
What does a client actually want from a weekly report?
They want three answers, fast:
- Are we making more money than last week?
- Which ads are doing the work, and are the new ones working yet?
- What are you going to try next?
Most report templates start with a wall of CTR, CPC and CPM. Those numbers matter to you. To the client, they're the "why," and the "why" only matters once they know the "what."
The agency's own requests followed this order. The first line of every ask was about the store: total sales, combined spend, blended return. Ads came second. The plan came last.
What sections go in a weekly client report?
Here's the template. Each row is one section, with the number to show and where that number should come from.
| # | Section | Metrics to show | Source of truth | Why the client cares |
|---|---|---|---|---|
| 1 | The answer | One sentence: up, down or flat, and the main reason | You | They may read nothing else |
| 2 | Store totals | Revenue, orders, AOV, total ad spend, blended ROAS (or MER), each vs last week | Shopify for revenue and orders; Meta + Google for spend | It's the money that hit their bank account |
| 3 | Month to date | Revenue and blended ROAS so far vs the month's goal, plus the daily pace needed | Shopify + ad platforms + the client's goal | Tells them if the month is on track while there's time to act |
| 4 | Channels and campaigns | Spend, platform-reported purchases and ROAS, CTR, CPC, per platform and per campaign, vs last week | Meta Ads, Google Ads | Shows where the budget went and what moved |
| 5 | Top ads | Top 5 to 10 ads by spend, with CTR, CPC, cost per purchase, and a status (scale, hold, cut) | Meta Ads (Google: asset groups) | "Which ad is working" is the question every client asks |
| 6 | New ads | Every ad that first spent money in the last 7 days, with spend and early signals | Meta Ads, Google Ads | Answers "did the new creatives start working?" |
| 7 | Customers | New vs returning customers, week on week | Shopify | Shows whether growth is bought or earned |
| 8 | Stock | Best sellers and their days of stock left | Shopify | Ads on a product that's about to sell out waste money |
| 9 | Data notes | Pixel gaps, late conversions, anything unusual | You | Stops a bad number from becoming a bad argument |
| 10 | Proposed next steps | 3 to 5 ideas, each with the number you'll watch | You | Turns the report into a meeting agenda |
Sections 1 to 3 fit on one screen. Sections 4 to 8 are the evidence. Sections 9 and 10 are what make the client trust the rest.
If the client shares product costs, add contribution margin to section 2. It's the number that tells you whether a good ROAS week was also a profitable one.
Why should Shopify be the source of truth for revenue?
Because Shopify counts every order once. Meta and Google each count the orders they helped with, using their own rules. Both are useful. They answer different questions.
- Shopify answers: how much did the store sell?
- Meta and Google answer: which orders did each platform help create, by its own rules?
Those rules overlap. On one of the agency's stores, Meta alone claimed about 8 of every 10 Shopify orders. Add Google's claims on top and the platforms "own" close to all of them, before you count email, organic search or people who'd have bought anyway.
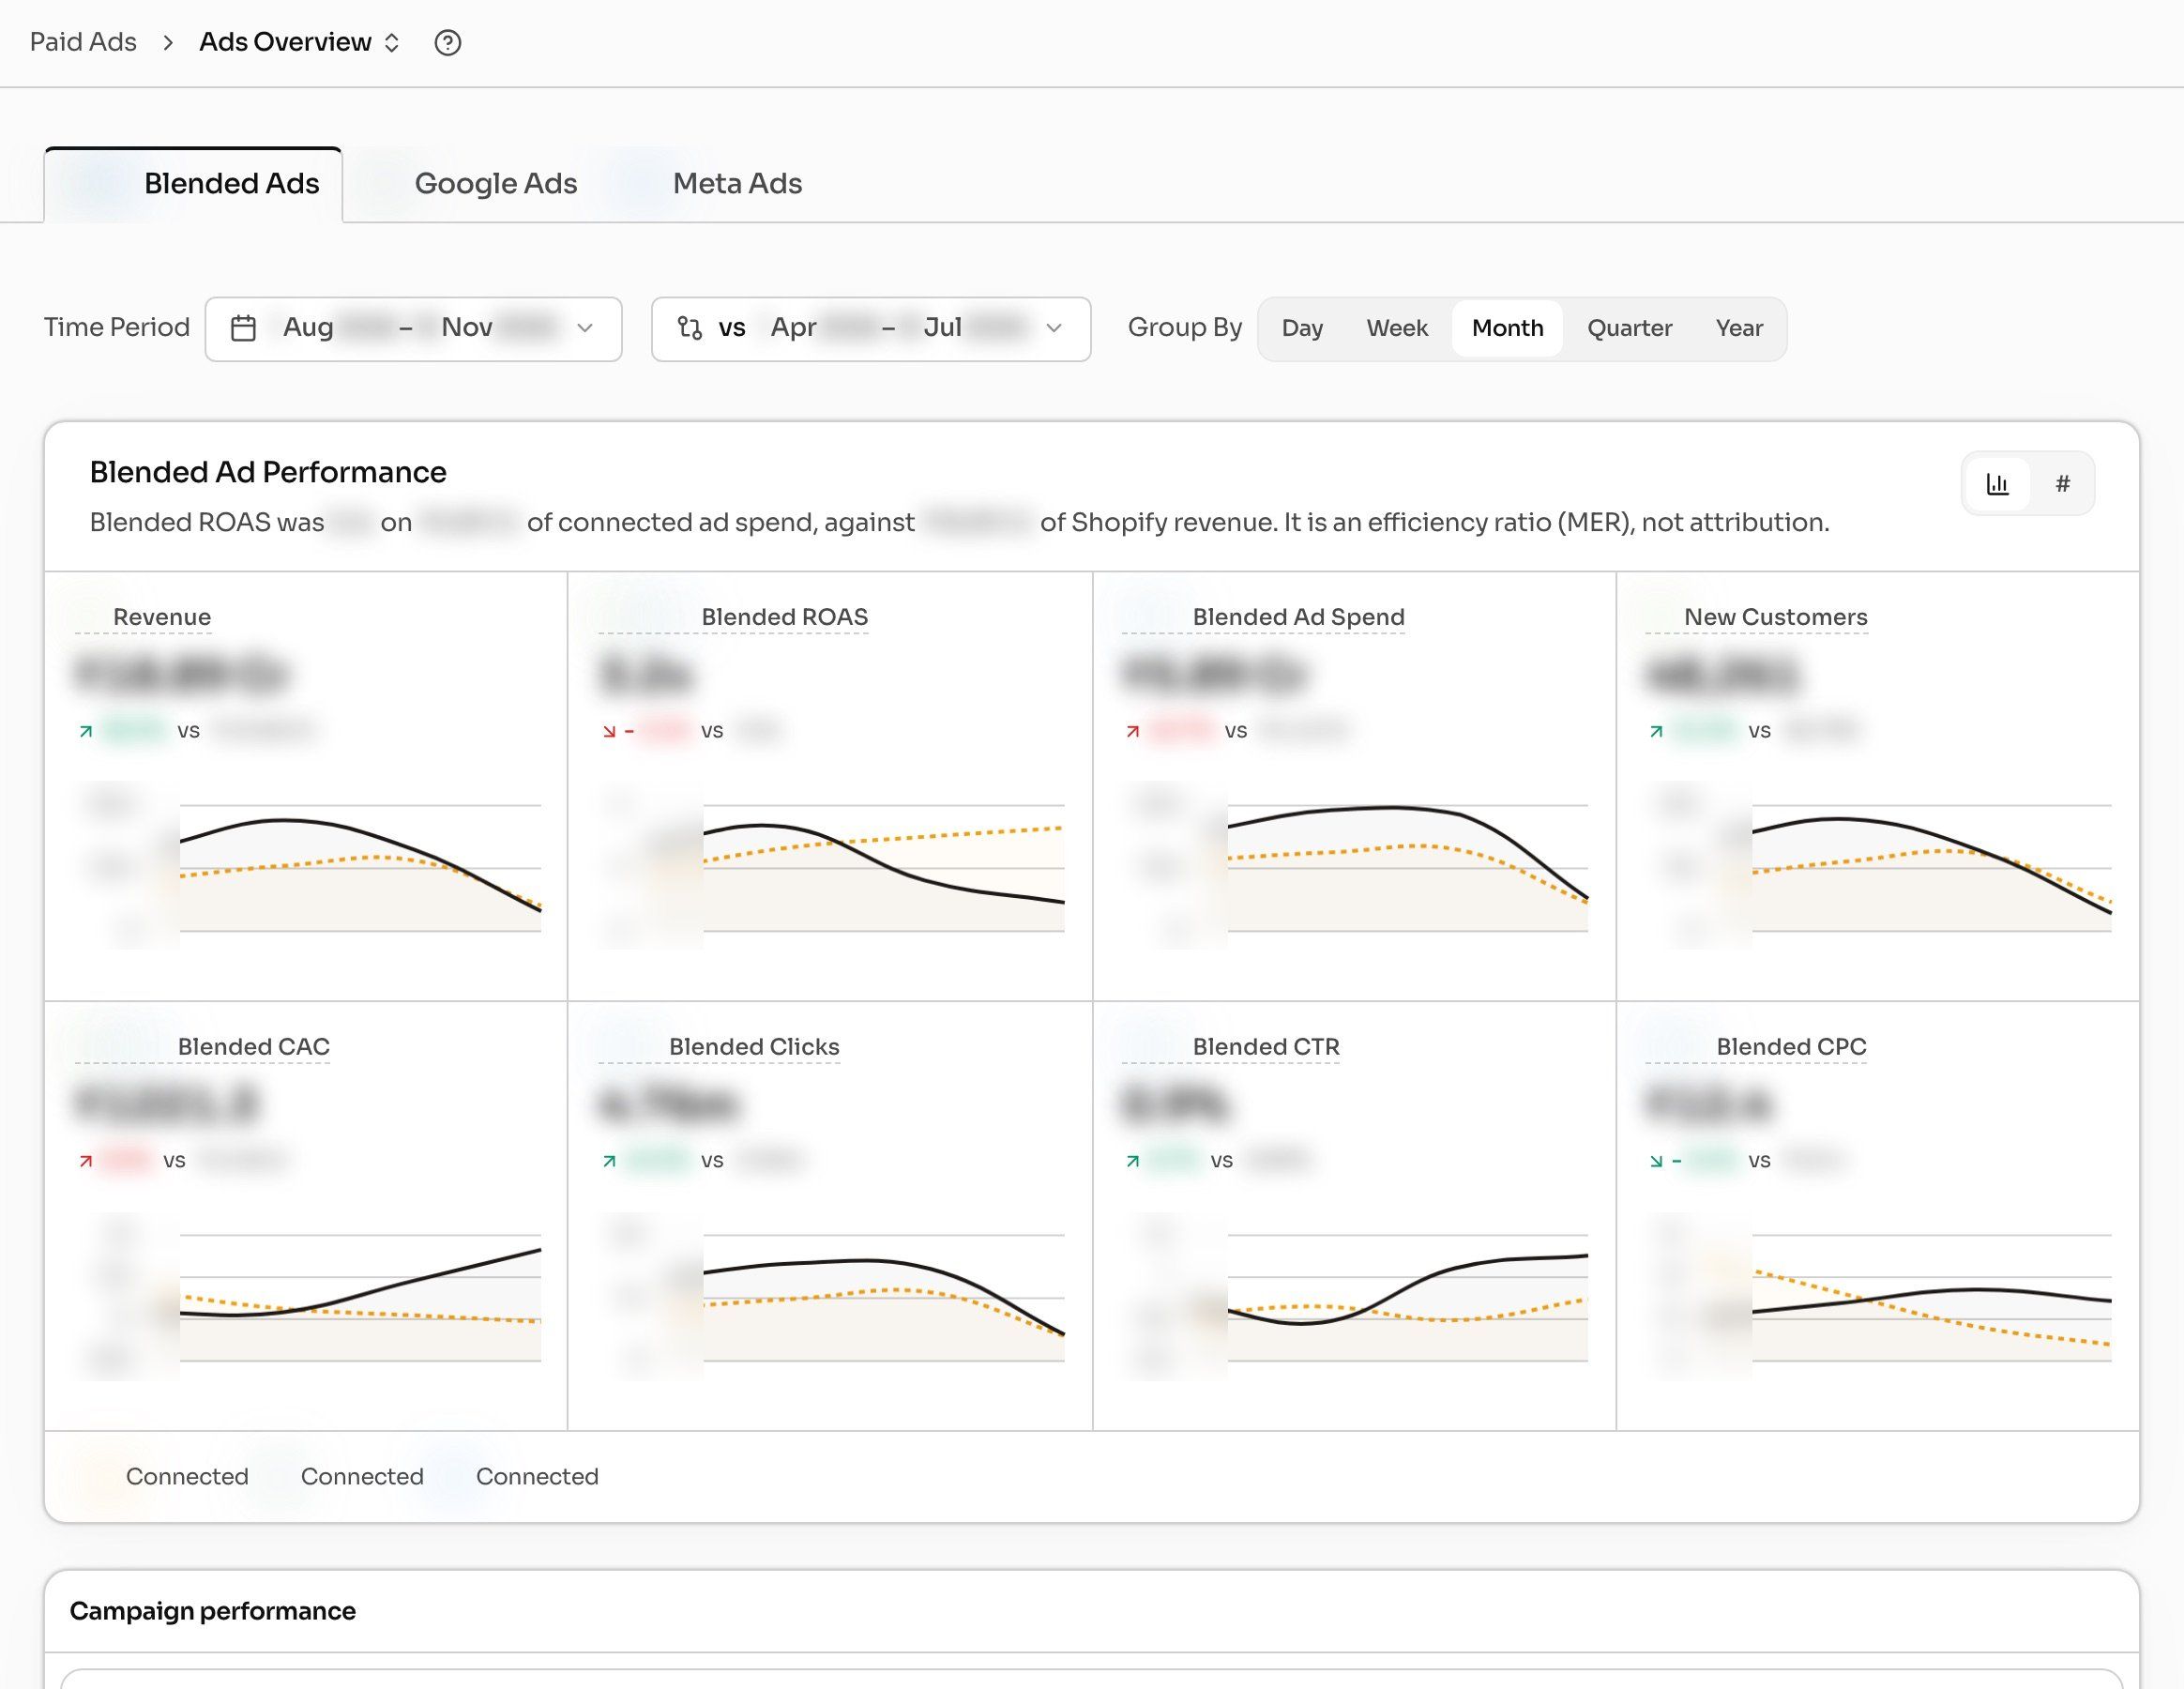
So never add Meta ROAS and Google ROAS together. Show each one in its own section, and use blended ROAS (all Shopify revenue ÷ all ad spend) as the headline. We cover the math in how to calculate blended ROAS across channels, and the limits in what blended ROAS can't tell you. If you prefer MER, it's the same idea; see marketing efficiency ratio.
Label every number with its source. "ROAS 2.4 (Meta-reported)" and "Blended ROAS 3.0 (Shopify revenue ÷ all spend)" can sit side by side without a fight.
How do you show week-on-week and month to date?
Show both, because they answer different questions.
- Week-on-week says what changed. Compare Monday to Sunday with the Monday to Sunday before. Same days, same length.
- Month to date says whether the month will land. Compare it with the client's goal, not with last month's total.
Show the change as a percentage and the raw number. "+12%" means little if it's 3 orders.
One trap: if you don't have the client's real goal, don't make one up. In one of the agency's reports, the first draft used placeholder targets because no real ones were given. A made-up goal makes the month look good or bad for no reason. Ask for the number once, then reuse it.
Worked example 1: month-to-date pacing (invented numbers)
| Item | Value |
|---|---|
| Monthly revenue goal | $160,000 |
| Days gone | 10 of 30 |
| Revenue so far (Shopify) | $48,000 |
| Current daily average | $4,800 |
| Run rate for the month | $4,800 × 30 = $144,000 |
| Pace vs goal | 90% |
| Needed per day for the rest of the month | ($160,000 − $48,000) ÷ 20 = $5,600 |
The useful line for the client isn't "we're at 90%." It's: "We need about $5,600 a day for the next 20 days, against $4,800 now. Here's how we plan to close the gap." That one sentence sets up section 10.
How do you show which ads are working?
Rank the top 5 to 10 ads by spend, not by ROAS. The ads that spend the most move the account. An ad with a 9x ROAS on $40 of spend is a curiosity, not a winner.
For each ad, show:
- Spend this week and last week
- CTR and CPC
- Platform-reported purchases and cost per purchase
- A one-word status: scale, hold or cut
Group ads under their campaign, so the client can see "which ad in which campaign," which is exactly how the agency phrased it. Show a thumbnail of the ad if you can. Clients remember creatives, not ad IDs.
Be clear about what ad-level numbers are. They come from Meta's and Google's own reporting. Use them to compare ads with each other. Don't expect them to add up to the Shopify total.
On Google, Performance Max gives very little single-ad data. Report it at the asset-group level and say so.
How do you report on new ads that started this week?
Give them their own section. "Have the new ads started working?" was in the agency's very first request, and it's the question clients care about most after a creative refresh.
A new ad is any ad whose first day of spend falls inside the last 7 days. For each one, show:
- Date it started spending
- Spend so far
- CTR and CPC against the account average
- Platform-reported purchases, if any
Then give it a fair verdict. Early signals (CTR, CPC, hook rate on video) show up in days. Purchases take longer. A common rule of thumb: don't call a new ad a winner or a loser until it has spent about 2 to 3 times your target cost per purchase. Meta's learning phase works the same way: it wants about 50 optimisation events per ad set in a week before delivery settles.
So most new ads get one of three labels in week one: "early signal good," "early signal weak," or "too early to call." "Too early" is an honest answer. Saying it stops the client from killing an ad on day two.
How do you report blended results when the pixel breaks?
Keep the report going. Change where the results come from.
When a tracking problem hits, Meta's reported purchases drop while real orders keep coming in. The ads didn't stop working. The counting did. If you report Meta ROAS that week, it looks like a bad week that never happened.
This is exactly the brief the agency gave: "Don't only take Meta ROI as there was a pixel issue for a few days. Take spends, CTR, CPC and other metrics from Meta, but take orders and revenue from Shopify."
Here's the method:
- Results from Shopify. Revenue and orders for the week come from Shopify, as always.
- Delivery from Meta. Spend, impressions, CTR and CPC don't depend on the pixel. Keep them.
- Headline on blended ROAS. Shopify revenue ÷ total spend. It doesn't need the pixel at all.
- Show the gap, don't hide it. Put daily Meta-reported purchases and daily Shopify orders next to each other, on separate charts or lines. The tracking gap shows on one and not the other.
- Mark the dates. Shade or note the affected days, and add a line to the data notes.
- Don't "fix" Meta's numbers by hand. Don't scale them up or guess. Say what happened and use the blended number for that period.
- Skip ad-level verdicts for those days. Cost per purchase by ad is unreliable while tracking is down. Judge ads on CTR and CPC that week, and come back to purchases once tracking is back.
Worked example 2: a pixel-outage week (invented numbers)
| Last week | This week | |
|---|---|---|
| Meta spend | $10,000 | $10,000 |
| Google spend | $3,000 | $3,000 |
| Shopify revenue | $40,300 | $39,000 |
| Blended ROAS (Shopify revenue ÷ all spend) | 3.1x | 3.0x |
| Meta-reported ROAS | 2.4x | 1.6x |
| Meta CTR / CPC | steady | steady |
If you lead with Meta ROAS, the headline is "Meta fell by a third." If you lead with blended ROAS, the headline is "flat week, tracking gap Wednesday to Friday." The second one matches what happened in the store. The data notes say: "Meta-reported purchases dropped on three days while Shopify orders held. Results for those days use Shopify orders. Ad-level purchase numbers for those days are left out."
Why can last week's numbers still change?
Two reasons, and both belong in the data notes.
Late conversions. Someone clicks an ad on Saturday and buys on Tuesday. Platforms add that sale later, so the last few days of any week keep creeping up.
Date basis. Google Ads counts a conversion on the date of the click by default, not the date of the order. The agency flagged "Google numbers are not correct" in one report. Spend was right. The conversions were on click date. Switched to order date, the week's Google return rose noticeably, and one campaign that looked like a leak turned out to be roughly break-even.
Pick one basis, say which one you use, and keep it every week. If a number from last week's report moves, say so in one line. Clients forgive a restated number. They don't forgive a quiet one.
What should the next-steps section say?
Three to five ideas, each tied to a number you'll watch. For example: "Move about 10% of budget from campaign A to campaign B. We'll watch blended ROAS and B's cost per purchase."
Write them as proposals. The agency asked for this directly: the plan should read "we are planning" and "what we're considering," not "we will do." A weekly report goes to a client before the call. Proposals start a conversation. Promises start an argument if one of them doesn't happen.
If a product in the top ads is low on stock, put that here too. In one of the agency's reports, the best sellers had about a week of stock left going into a busy sales period, while ads still pointed at them. That's a next step, not a footnote.
How long should a weekly client report be?
One screen for the answer, one or two pages for the evidence. If the client reads only the top, they should still know how the week went.
The ranking guides agree on keeping the core to 5 to 8 metrics. That's right for the top. The detail can live below, as long as nothing below contradicts the top.
Also: the numbers refresh, but the words don't. If you reuse a dashboard every Monday, rewrite the summary and next steps every Monday. Last week's insight sitting under this week's numbers is how reports lose trust.
How do you build this report with Drew?
Drew connects to Shopify, Meta Ads, Google Ads and GA4 with read-only access, so it can pull each section from the right source. It can't change anything in the store or the ad accounts. Paste this in and fill the brackets:
Build my weekly client report for last week (Monday to Sunday) vs the week before, plus month to date against these goals: revenue [goal], blended ROAS [goal].
Take revenue, orders, AOV and new vs returning customers from Shopify. Take spend, CTR, CPC and platform-reported purchases from Meta and Google. Don't add the platforms' purchases together. Use blended ROAS (Shopify revenue ÷ total spend) as the headline.
Sections: 1) one-line answer, 2) store totals vs last week, 3) month to date vs goal and the daily pace needed, 4) Meta and Google by campaign, week on week, 5) top 10 ads by spend with CTR, CPC and cost per purchase, grouped by campaign, 6) every ad that first spent in the last 7 days, 7) best sellers and days of stock left, 8) daily Meta-reported purchases next to daily Shopify orders, flagging any day where they split sharply, 9) data notes, including which numbers may still change, 10) three to five proposed next steps, written as "for discussion."
Tell me which date basis you used for Google conversions.
If you want this as a live dashboard you send every Monday instead of a one-off answer, our guide to live dashboards for Shopify agencies covers the setup per client. If you work inside Claude, see connecting Shopify to Claude for a live dashboard. And when a Monday number looks wrong, the ROAS-down root-cause framework is the next step.
FAQ
Should a Shopify ads agency send weekly or monthly reports?
Both. Weekly reports cover what changed and what you'll try next. Monthly reports cover the bigger picture: goal vs actual, customer trends, and strategy. New clients, new campaigns and high-spend accounts usually need weekly. Stable accounts can move to every two weeks.
What's the difference between blended ROAS and platform ROAS in a client report?
Blended ROAS is all Shopify revenue divided by all ad spend. It shows whether the total ad budget is paying back. Platform ROAS is what Meta or Google reports for the orders it helped create, by its own rules. Use blended for the headline and platform ROAS to compare campaigns and ads inside one platform.
Can I add Meta ROAS and Google ROAS together?
No. Each platform counts the orders it touched, and many orders touch both. Adding them double-counts sales. On one store we saw, Meta alone claimed about 8 in 10 Shopify orders.
What do I report when the Meta pixel stops working for a few days?
Report results from Shopify orders, keep spend, CTR and CPC from Meta, and lead with blended ROAS. Show daily Meta-reported purchases next to daily Shopify orders, mark the affected dates, and skip ad-level purchase verdicts for those days.
Do I need a reporting tool to make this report?
Not for the content. The sections above work in a spreadsheet, Looker Studio, or a tool like AgencyAnalytics or Whatagraph. What matters is that each number comes from the right source and is labelled. An AI agent like Drew helps when you want the "why" and the next steps, not just the charts. See how Shopify agencies use AI.
How do I show a new ad isn't working yet without scaring the client?
Label it "too early to call" until it has spent about 2 to 3 times your target cost per purchase. Show its CTR and CPC against the account average as early signals. Clients accept "not yet" when you tell them when "yet" will be.
Want the report without the Monday spreadsheet?
Install Drew from the Shopify App Store, connect Shopify, Meta and Google, and paste the prompt above. Drew reads your data. It doesn't change anything.