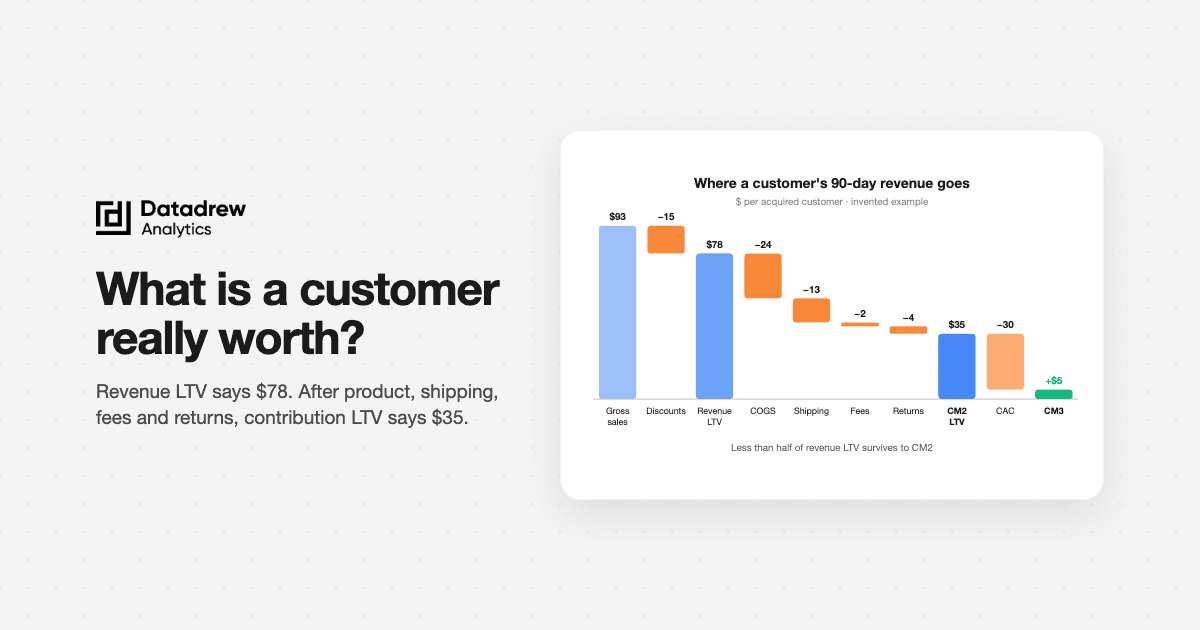
Contribution margin LTV is the money a customer leaves you after product cost, shipping, payment fees, returns and discounts, added up over a set window like 90 days. It is usually less than half of revenue LTV. In our worked example below, revenue LTV says a customer is worth $78 in 90 days, gross-margin LTV says $54, and contribution LTV says $35. If you set your CAC limit from the first number, you'll pay about twice what the customer can pay back.
This post shows how to calculate it per customer and per cohort on Shopify, step by step. We also share what happened when Shopify brands asked Drew, DataDrew's AI agent, for this exact number, including what it couldn't calculate. Brands aren't named. All dollar figures are invented, round, and labelled.
TL;DR
- Contribution LTV = the sum of each customer's contribution margin (CM2) across every order in a window. CM2 is net revenue minus product cost, shipping, payment fees and returns.
- Revenue LTV overstates what you can pay for a customer by about 2x in a typical margin structure. Gross-margin LTV still overstates it by about 1.5x.
- First orders and repeat orders have different margins. First orders carry the big discount and the CAC. Don't multiply revenue LTV by one margin percentage.
- Your max CAC = contribution LTV over the payback window you can fund. 90 days if cash is tight, 6–12 months if it isn't.
- Most stores can't calculate it yet because costs are missing. In one store, almost no units had a cost recorded in Shopify. Fix "Cost per item" first.
What is contribution margin LTV?
Contribution margin LTV is what an acquired customer is worth in profit you can spend, not in sales. You take every order the customer placed in a window, work out the contribution margin on each one, and add them up.
We use the same margin levels as our guide to contribution margin before scaling:
| Level | What it subtracts from net revenue | What it tells you |
|---|---|---|
| CM1 | Landed product cost (COGS) | Is the product priced right? |
| CM2 | CM1 minus shipping, fulfilment, payment fees, returns | What an order really leaves you |
| CM3 | CM2 minus marketing | What's left after you paid to get the order |
So:
- Contribution LTV (CM2 LTV) = the sum of CM2 across a customer's orders in the window.
- CM3 LTV = contribution LTV minus what you paid to acquire and keep that customer.
A naming warning. Some teams and tools call the after-marketing number "CM2." One brand asked Drew for "CM2: what did the customer bring after marketing, COGS and operating cost." In our terms that's CM3. Neither is wrong. Just write your definition next to the number, or two people will compare different things.
Why does revenue LTV mislead?
Revenue LTV counts money you never keep. It's fine for spotting trends. It's dangerous for setting a CAC limit.
Three things make it worse than it looks:
- Costs scale with orders, not just revenue. Every repeat order needs picking, packing, a shipping label and a payment fee.
- Discounts cut revenue but not product cost. A 30% welcome code shrinks the order's revenue by 30%. It shrinks the margin on that order by much more.
- The first order carries the CAC. Repeat orders don't. A revenue curve hides the moment the customer actually pays you back.
The common fix is "multiply revenue LTV by your gross margin." Our own customer LTV guide shows that shortcut. It's better than revenue, but it still stops at product cost. It skips shipping, fees and returns, and it assumes every order has the same margin.
How do you calculate contribution LTV, step by step?
Here's the process for one cohort, such as all customers whose first order fell in a given month.
- Pick the cohort and the window. For example, first orders in March, measured 90 days from each customer's first order (not 90 calendar days).
- Only use cohorts that have finished the window. A customer who ordered 20 days ago hasn't had 90 days to come back.
- Pull every order for those customers inside the window: net revenue (after discounts and refunds, excluding tax and shipping charged).
- Subtract product cost per order using the cost at the time of sale. That's CM1.
- Subtract shipping, fulfilment, payment fees and returns per order. That's CM2.
- Add up CM2 per customer, then divide by the number of customers in the cohort. That's your 90-day contribution LTV.
- Subtract cohort CAC (and any retention marketing cost) to get CM3 LTV. If it's above zero, the cohort has paid back.
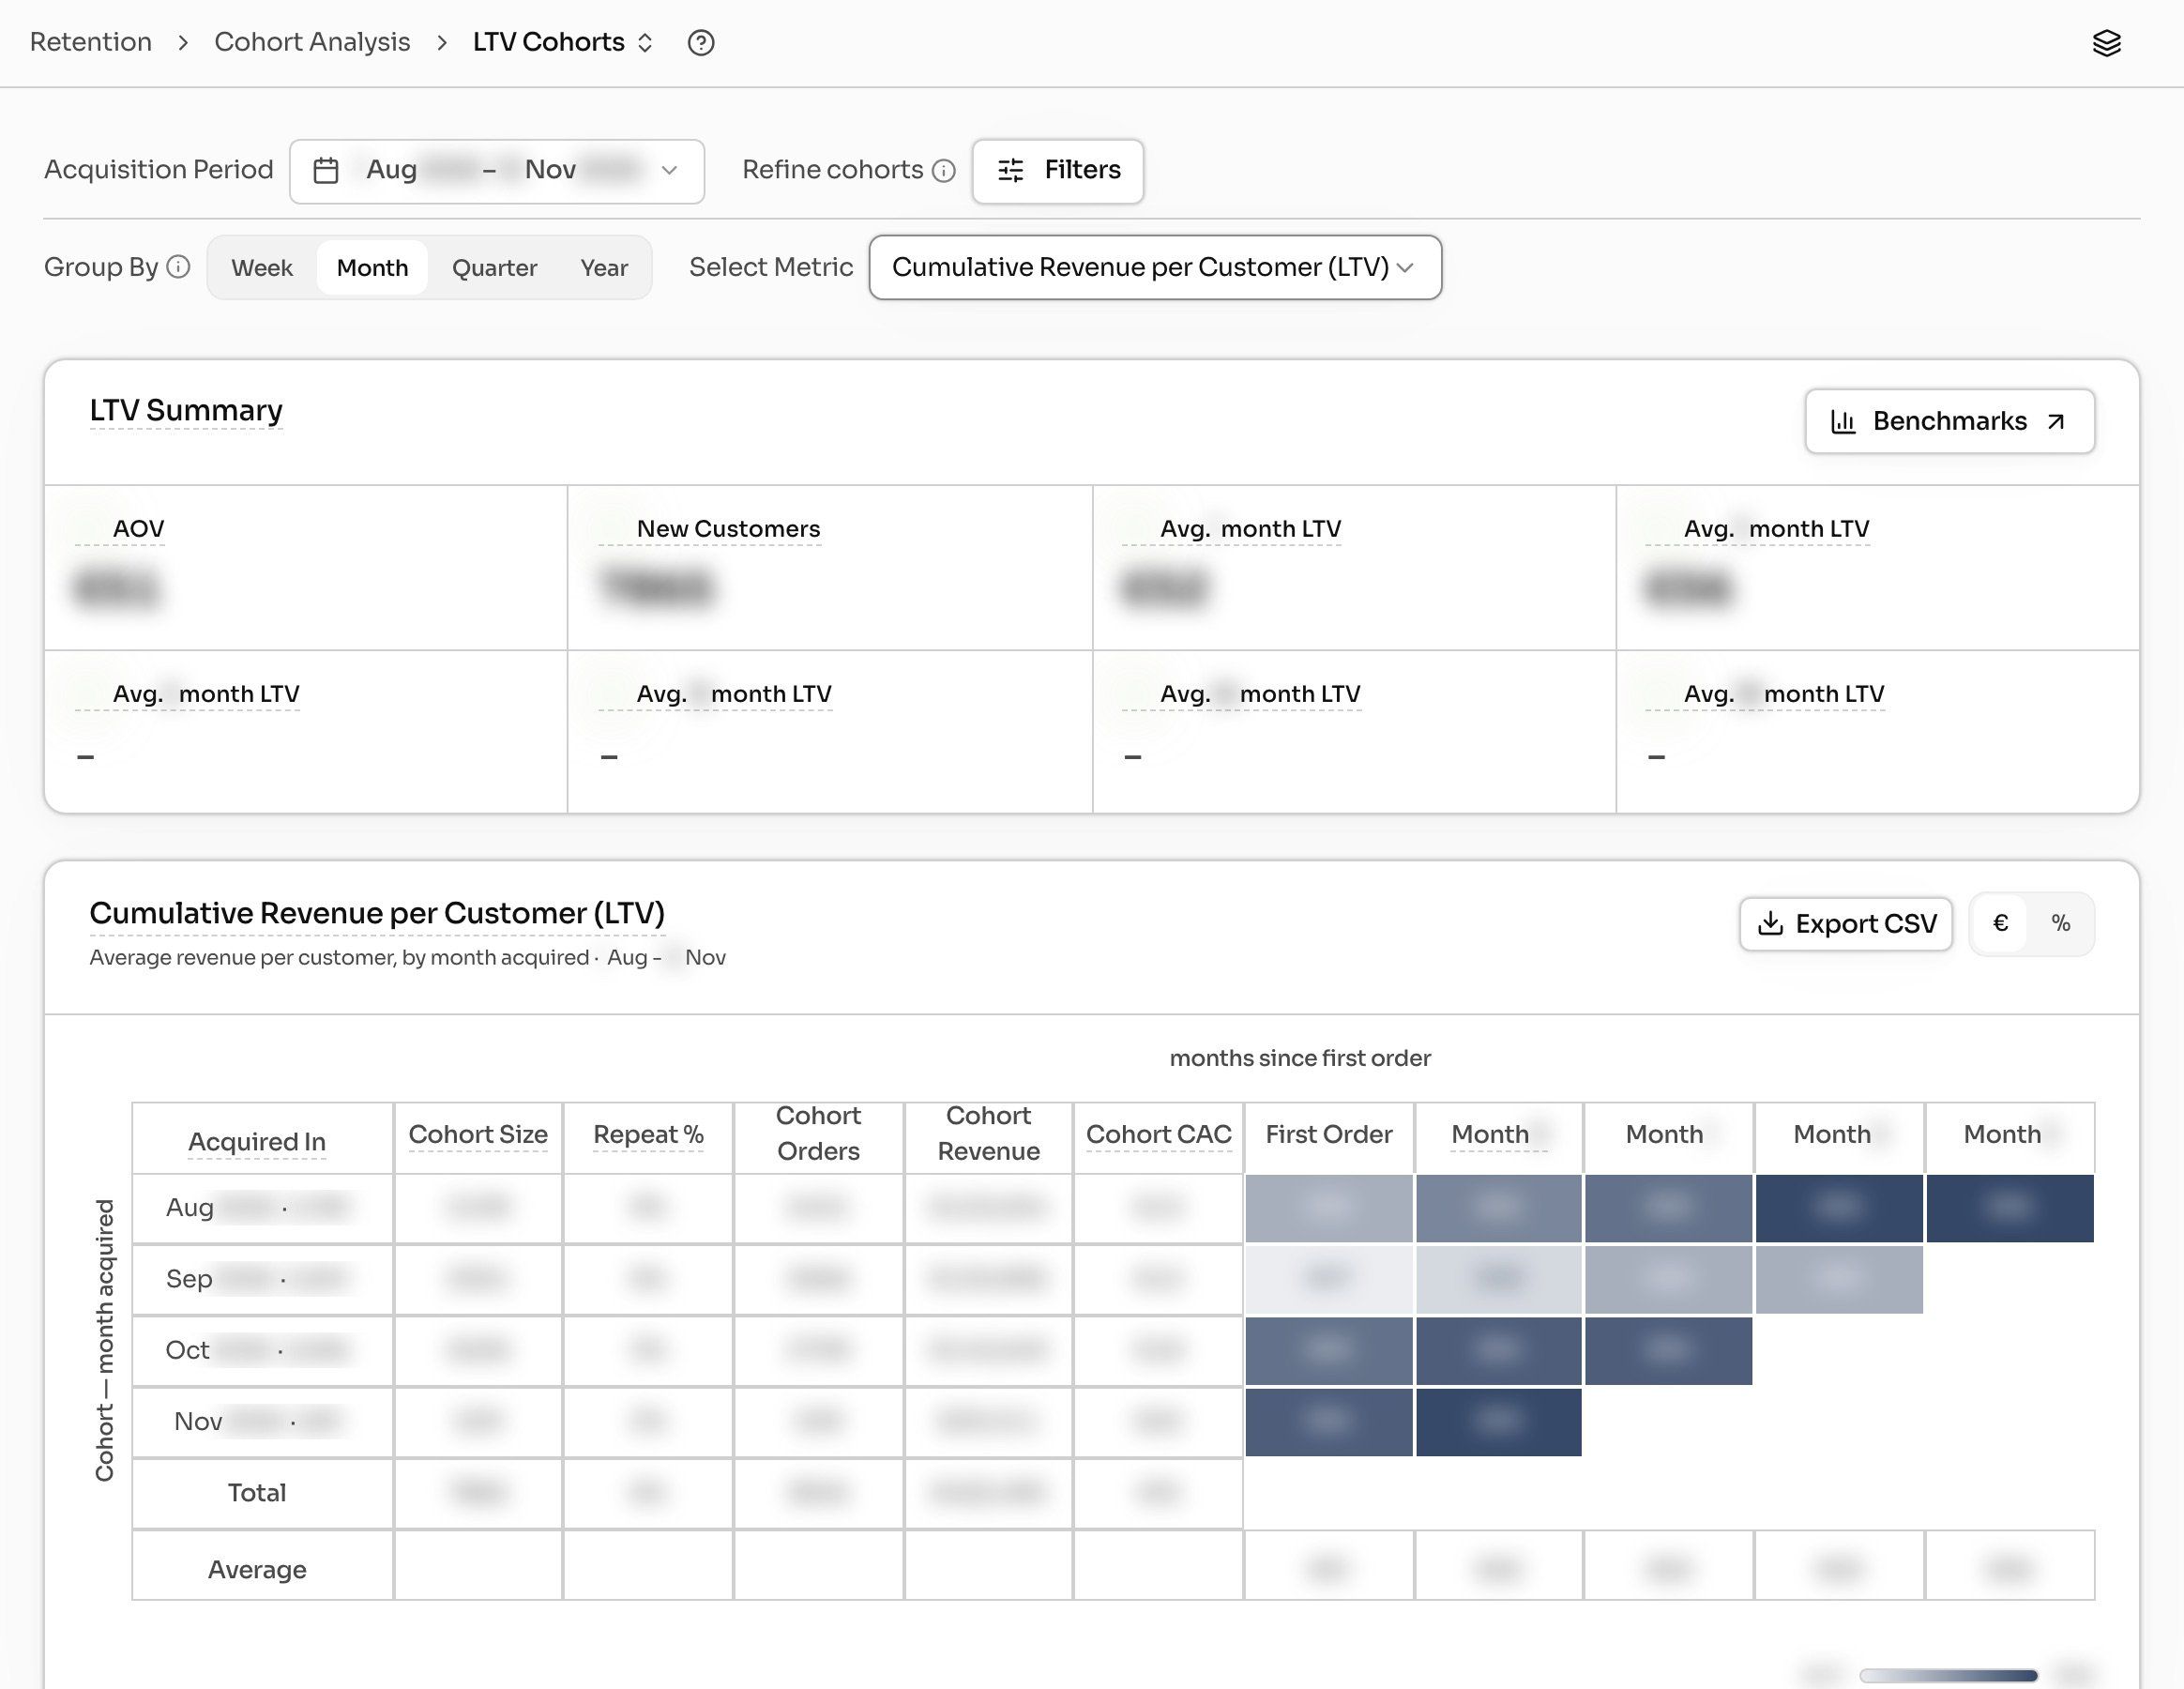
Then repeat at 30, 60, 180 and 365 days. The curve tells you more than any single number. Our cohort analysis guide covers how to read the shape.
Where do you find each input in Shopify?
| Input | What it is | Where to get it on Shopify | Common trap |
|---|---|---|---|
| Gross sales | List price × units | Analytics → Reports → Sales | Includes discounts you never collected |
| Discounts | Codes, automatic discounts, bundle and subscription savings | Sales report, discounts column | Pack and subscription prices hide discounts inside the price |
| Net revenue | Gross sales − discounts − returns, excl. tax and shipping charged | Sales report (net sales) | Some reports include shipping charged; strip it out |
| Product cost (COGS) | Landed unit cost | Each variant's Cost per item; profit reports | Shopify only counts cost recorded at the time of sale; blanks count as zero |
| Shipping you pay | Label cost per order | Shopify Shipping label charges in your bills, or your 3PL invoice | Free-shipping offers move this cost onto you |
| Fulfilment and packaging | Pick, pack, box | 3PL invoice or your own per-order estimate | Usually missing entirely |
| Payment fees | Card and gateway fees | Finance → Payouts (transaction fees) | Varies by gateway and country |
| Returns | Refunds plus return label and lost stock | Sales report returns + label costs | Refund value is only part of the cost |
| CAC | Marketing spend ÷ new customers | Ad platform spend; new-customer count from Customers reports | Blended vs paid gives different answers |
| Retention marketing | Email, SMS, loyalty tools | Tool invoices | Small per order, but not zero |
Product cost is where most stores break. If you only fix one thing this week, fill in "Cost per item" on every variant.
What does a contribution LTV waterfall look like?
Here's one acquired customer's first 90 days, using invented round numbers. The customer places a first order with a 20% welcome discount. On average, the cohort places 0.6 more orders in 90 days, so 1.6 orders per customer.
Worked example 1 (invented numbers):
| Line, per customer over 90 days | First order | Repeat orders (0.6 × one order) | Total |
|---|---|---|---|
| Gross sales | $60 | 0.6 × $55 = $33 | $93 |
| Discounts | −$12 | 0.6 × −$5 = −$3 | −$15 |
| Net revenue (revenue LTV) | $48 | $30 | $78 |
| Product cost | −$15 | 0.6 × −$15 = −$9 | −$24 |
| Gross-margin LTV | $33 | $21 | $54 |
| Shipping paid | −$8 | −$4.80 | −$12.80 |
| Payment fees (~3%) | −$1.50 | −$0.90 | −$2.40 |
| Returns allowance | −$2.50 | −$1.50 | −$4 |
| Contribution LTV (CM2) | $21 | $13.80 | ≈ $35 |
| CAC | −$30 | – | −$30 |
| CM3 LTV at day 90 | ≈ +$5 |
Look at the three LTVs side by side:
- Revenue LTV: $78
- Gross-margin LTV: $54 (about 1.5x the contribution number)
- Contribution LTV: $35 (about 45% of revenue LTV)
That's the gap we mean when we say revenue LTV overstates what you can pay by about 2x. Your exact ratio depends on your product cost, shipping policy and discount depth. A high-margin, light product will be closer than this. A heavy product with free shipping will be further apart.
How much can you pay for a customer if you know your 90-day LTV?
Your max CAC is your contribution LTV over the payback window you can afford to fund. Not revenue LTV, and not gross-margin LTV.
The payback window is a cash decision, not a math one. The longer you can wait to get your money back, the more you can pay up front.
Worked example 2 (invented, same store as above):
| Payback window | Contribution LTV in that window | Max CAC to break even | When to use it |
|---|---|---|---|
| 90 days | $35 | ~$35 | Cash is tight, or you're testing a new channel |
| 6 months | ~$44 | ~$44 | Steady repeat rate, some cash buffer |
| 12 months | ~$53 | ~$53 | Proven retention, strong cash position |
If the store had used 90-day revenue LTV as its ceiling, it would have bid up to $78. Every new customer would have lost about $43 by day 90, and the 12-month curve would never have caught up.
Two rules make this safer:
- Break-even is a ceiling, not a target. Leave room for fixed costs and profit, for example by aiming for CAC at 60–80% of the window's contribution LTV.
- Use the CAC that matches the decision. Blended CAC tells you if the business works. Paid-only CAC tells you if the ads work. Our marginal ROAS guide explains why the last dollar you spend matters more than the average.
Why do first orders and repeat orders need separate margins?
Because the first order carries the discount, the bigger box, sometimes a free sample, and the whole CAC. Repeat orders usually carry none of that. A single margin percentage blends them and hides your payback.
Worked example 3 (invented): the welcome discount. Same $60 first order, $15 product cost, $12 shipping, fees and returns.
| Welcome discount | First-order revenue | First-order CM2 | Change in revenue | Change in CM2 |
|---|---|---|---|---|
| 20% | $48 | $21 | – | – |
| 30% | $42 | ~$15 | −12.5% | about −29% |
Ten more points of discount cut revenue by an eighth. They cut contribution by more than a quarter, because product cost and shipping didn't move. To earn it back, the bigger discount has to lift your second-order rate a lot, not a little.
The same thing happens with pack sizes and subscriptions. One brand asked Drew for the selling price of a single unit after all discounts, across every pack size and subscription. The answer differed by pack, and multipacks shipped free at almost any price. Over the year, the share of one-time orders that paid for shipping fell from about 1 in 3 to about 1 in 6. Revenue per order barely moved. The brand's shipping cost per order went up, and none of that shows in revenue LTV.
What happened when brands asked Drew for contribution LTV?
Two brands asked for close to this exact number in the last month. Here's what came back, anonymised and rounded.
Brand 1: "What is our 90-day contribution LTV per acquired customer?" Drew returned 90-day net revenue per customer instead, and said why. Almost no units sold had a product cost recorded, and there was no shipping or payment-fee data. It didn't guess a margin. What it did show:
- 90-day revenue per customer was nearly 3x the first order.
- Newer cohorts were weaker: 90-day revenue per customer was down about 15–20%, and the share placing a second order within 90 days fell from about 55–60% to about 40–45%.
- Blended CAC was about three-quarters of 90-day revenue. Drew flagged, as an estimate, that after product cost and shipping, the cohort probably hadn't paid back in 90 days.
That's the point of this whole post. On revenue, the cohort looked paid back. On contribution, it probably wasn't.
Brand 2: "I need CM2 per cohort, not CLV on net revenue." Drew confirmed that DataDrew's built-in cohort view shows revenue per customer, repeat rate and CAC per cohort, but no margin. It then checked what was available to build one:
- Product costs covered about three-quarters of revenue, on under a third of products.
- The cost applied to past sales was today's cost, not the cost at the time.
- Several products had identical costs, which looked like placeholders.
- No actual shipping or payment-fee data.
Drew offered to build CM1 and CM2 cohort tables with the gaps labelled as assumptions, and asked for a per-order shipping estimate and a fee rate to get further.
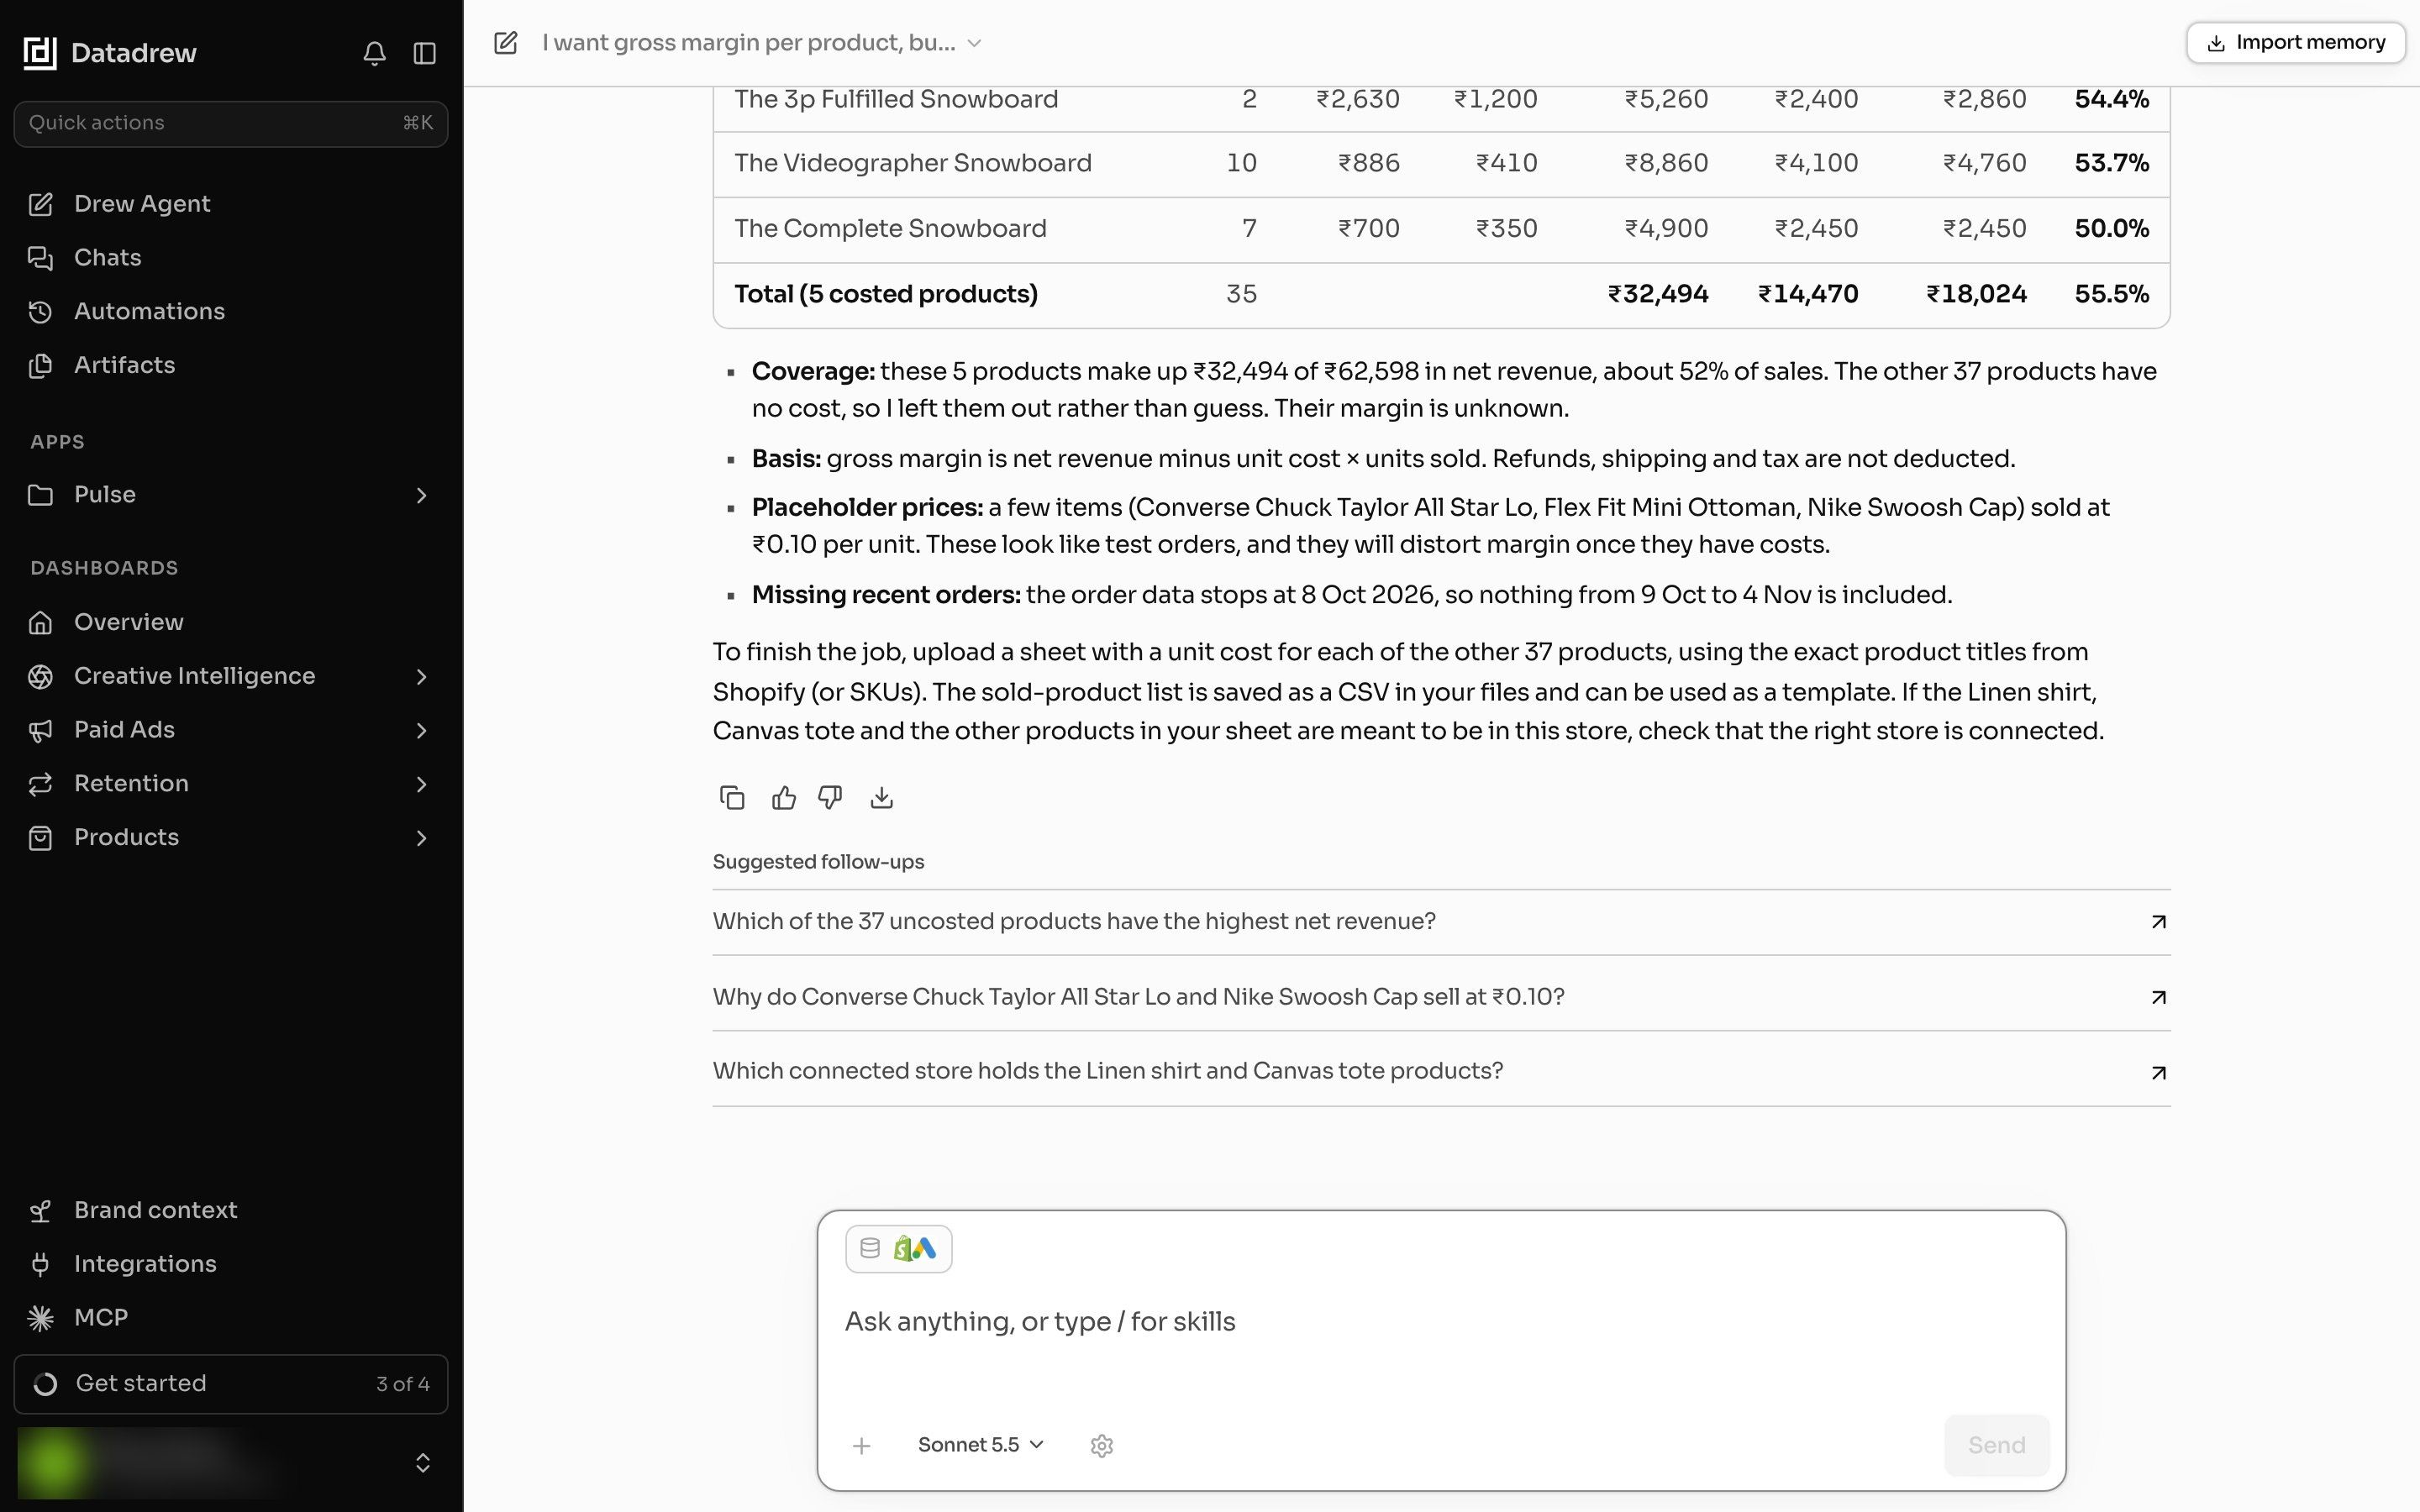
The lesson for any store: contribution LTV is a data problem before it's a math problem. Check your cost coverage before you trust any margin number, from any tool.
Which levers move contribution LTV the most?
In rough order of impact for most Shopify stores:
- Second-order rate inside the reorder window. One brand found about 3 in 4 of its second orders landed before day 30. Measure at 30, 60 and 90 days, not just "ever." See our repeat purchase rate benchmarks.
- First-order discount depth. As example 3 shows, it hits contribution twice as hard as revenue.
- Shipping policy. Free-shipping thresholds and free multipacks move cost onto you. Price them on contribution, not revenue.
- Return rate. Each return costs the refund, two labels, and sometimes the stock.
- Churn after the second order. Customers who stop early cap your curve. Our guide to calculating customer churn covers how to measure it.
If you want the strategy behind these, our retention-first growth post explains why the second order matters more than the first.
What should you paste into Drew?
Drew can calculate contribution LTV on request, from your Shopify orders and the costs it can find. It will tell you which inputs are missing rather than guess. Copy this into Drew and change the dates and assumptions:
"Calculate 90-day contribution LTV per acquired customer for first-order cohorts from January to June. Use net revenue after discounts and refunds, excluding tax and shipping charged. Subtract product cost from Shopify cost per item, plus $X shipping and fulfilment per order, Y% payment fees, and returns. Split first orders from repeat orders. Show revenue LTV, gross-margin LTV and contribution LTV side by side, then compare with blended CAC per cohort. Before you start, tell me what share of revenue has a product cost recorded, and list anything else that's missing."
Then follow up with:
- "At what day does each cohort's contribution LTV cover its CAC?"
- "What's our 90-day first-to-second-order rate by cohort, using only cohorts that have finished 90 days?"
- "What's the average selling price per unit after all discounts, by pack size, excluding shipping and tax?"
The last line of the main prompt matters most. A margin number built on missing costs is worse than no number.
FAQ
What is contribution margin LTV?
It's the total contribution margin a customer generates over a window, such as 90 days or 12 months. Contribution margin is net revenue minus product cost, shipping, fulfilment, payment fees and returns. Subtract CAC from it and you get CM3 LTV.
Is LTV calculated on revenue or margin?
Use margin for any spending decision. Revenue LTV is fine for spotting trends, but it can be about twice the contribution figure. Shopify's own content often defaults to revenue, so always label which one you're using.
How do you calculate 90-day LTV?
Take customers whose first order fell in a period, add up their orders in the 90 days after each first order, and divide by the number of customers. Only use cohorts that have finished the full 90 days. For contribution LTV, add up each order's contribution margin instead of its revenue.
What's the difference between gross margin LTV and contribution margin LTV?
Gross-margin LTV subtracts only product cost. Contribution LTV also subtracts shipping, fulfilment, payment fees and returns. In our invented example, gross-margin LTV was about 1.5x contribution LTV.
What's a good contribution LTV to CAC ratio?
On a 12-month contribution basis, anything comfortably above 1x pays back, and 2x or more leaves room for fixed costs and profit. The common 3:1 benchmark is easier to hit on revenue, which is exactly why revenue ratios mislead. Our post on the LTV to CAC ratio goes deeper.
Why can't my analytics tool show contribution LTV?
Usually because the costs aren't in the data. Shopify only counts product cost recorded at the time of sale, and shipping, fulfilment and fees often live outside Shopify. Fill in "Cost per item" on every variant, then add per-order estimates for the rest.