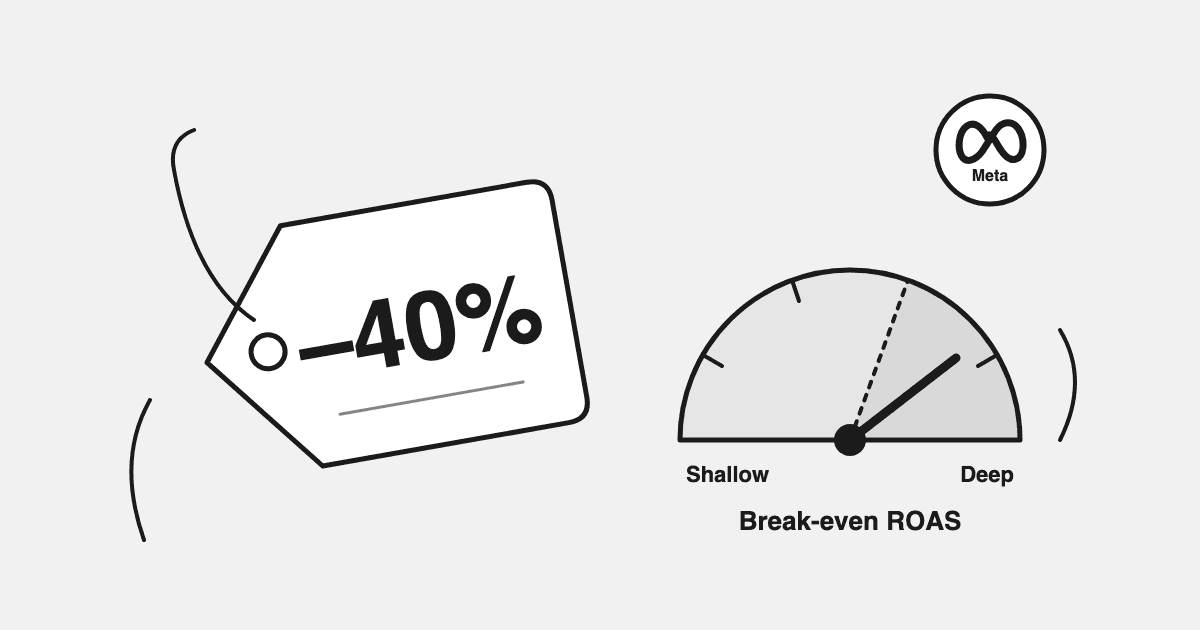
"every sale from this campaign loses $2.40."
The campaign in question ran at 3.5x ROAS. The product was a t-shirt with a 25% return rate and $10 of shipping per order, and the line comes from a merchant's own profit write-up, verified in Datadrew's operator research in July 2026. Nothing in the ad account said anything was wrong. The discount, the shipping and the returns were all sitting in the gap between the ROAS column and the bank balance, and the sale made the gap wider.
This is for the Shopify founder-operator or growth lead deciding the sale offer in October, sitewide 20%, 30%, product-level, free shipping, while planning the Meta and Google budget behind it. Search returns consumer coupon pages and discount-psychology listicles that never connect the discount to the ad spend or the margin. This piece does, with a table you can run on your own numbers. It sits under the promotion strategy hub; the sale-week playbook itself is running a BFCM sale on Meta and Google.
Key Takeaways
- → The discount comes straight off contribution before the ad dollar does. A product at 50% margin at full price is at 37.5% at 20% off and 25% a third off; its break-even ROAS moves from 2.0x to 2.7x to 4.0x before shipping and returns.
- → A discount has three legitimate jobs, acquire, convert or clear, and each gets a different depth and a different ad budget. Pick the job before the number.
- → The share of sale-week orders that were returning customers, straight from Shopify, tells you how much of the discount bought nothing.
- → Whether the sale bought customers who come back is readable three and six months later, by first product bought, from Shopify orders alone. That read sets next year's depth.
- → During the sale week: never scale spend because gross revenue is above normal.
Two frameworks, and the one number they disagree on
The revenue-maximising frame asks whether the sale set a record. It is the frame the platforms report in, the frame the dashboard is built for, and the frame in which the t-shirt campaign above was a success at 3.5x. The margin-aware frame asks what each discounted order left after the discount, the shipping, the returns and the ad dollar. It is the frame the accountant works in, usually a month later.
ROAS is a revenue multiple. It ignores COGS, shipping, fees and discounts, and a sale is the week when all four move at once. The two frames agree on almost nothing during a promotion, and only one of them can set the ad budget. Curtis Howland, DTC growth operator: "When Meta says ROAS is 4x and your P&L says you lost money, your P&L is right."
The break-even shift: what the discount does to the ROAS you need
Start with the margin you know for the product at full price, before ad spend. Contribution margin is price minus discount, COGS, shipping and fulfilment, fees and the expected cost of returns; the full definition and the per-SKU check are in contribution margin before scaling. A discount comes off the top of that margin, not off the top of the price, which is why it hurts more than it looks.
Worked on a product you know runs at 50% margin at full price, before shipping and returns:
| Discount | Margin left, as % of discounted price | Break-even ROAS | A 3.5x campaign means |
|---|---|---|---|
| 0% | 50.0% | 2.00x | Comfortable |
| 10% | 44.4% | 2.25x | Fine |
| 20% | 37.5% | 2.67x | Thinner than it looks |
| 30% | 28.6% | 3.50x | Break-even, before shipping and returns |
| 40% | 16.7% | 6.00x | A loss on every order |
The formula behind the table: margin left as a share of the discounted price is (margin % − discount %) ÷ (1 − discount %), and break-even ROAS is 1 ÷ that share. At 30% off, a 50%-margin product needs exactly the 3.5x the t-shirt campaign was earning, and that is before the $10 of shipping and the 25% return rate that turned it into a $2.40 loss per sale. Shipping is a fixed cost per order that a deeper discount does nothing to shrink; returns unwind the margin and cost the shipping both ways, which is why the return rate hits deeper discounts harder.
Discount-depth break-even table. Your list price, the margin you know at full price, the shipping you pay per order and your return rate. What an order leaves at 0 / 10 / 20 / 30 / 40% off, and the ROAS the ads must clear at each depth. This table takes the margin you type in. Inside Datadrew, gross margin comes from the unit costs you keep in Shopify; shipping, fees, returns and your target are what you confirm.
Formula, visible: margin left per order = (1 − return rate) × price × (margin % − discount %) − shipping − return rate × shipping (the return label; outbound shipping is already counted on every order). Break-even ROAS = discounted price ÷ margin left.
The three legitimate jobs of a discount
A discount can do three things, and a sale that has not decided which one it is doing will do the most expensive one by default.
Acquire. Buy a customer who comes back. The discount is an acquisition cost, and the depth is justified by what the customer is worth afterwards, which means it should sit on the products that bring repeat buyers and be read against the cohort it produces (below). This job can justify the deepest discount, and only this job.
Convert. Harvest demand that was already coming: the cart abandoners, the returning customers, the people who were going to buy this month anyway. This is the cheapest job and the most dangerous, because most of the orders it produces would have arrived at full price. The share of sale-week orders that were returning customers, straight from Shopify, is how much of the discount bought nothing. A convert discount should be shallow, short and targeted, and its ad budget should be small, because the audience already knows you.
Clear. Move stock within margin rules: end-of-season, overstock, a size run that will not sell through. Depth is whatever clears the units while leaving the margin you set as the floor, and the ad budget is sized to the units, not to a revenue target. A clearance that gets a scaling budget because revenue is up has confused this job with the first one.
Each job gets a different depth from the table above and a different ad budget behind it. The mistake that produces the $15,000 loss is running a clearance-depth discount sitewide with an acquisition-sized ad budget, and reading the revenue as success.
Sitewide versus product-level: the returning-customer subsidy
A sitewide discount pays the deepest price on the customers who needed it least. Pull your last sale's orders from Shopify and split them into first-time and returning. If 60% of sale-week orders were returning customers, then 60% of the discount was paid to people who had already chosen you, and a share of those would have bought at full price that month. That share is the subsidy. It is not visible in ROAS, because ROAS counts the order the same way either way.
Product-level discounts on gateway products, the ones whose first-time buyers come back, do the acquisition job at a fraction of the cost, because the discount sits where the new customers are and not on the reorders. Which products those are is a Shopify question, not an ad question: which SKUs drive repeat buyers shows the read, and the product performance hub carries the wider decision of which products deserve the ad budget at all.
Did the discount buy a repeat customer, or subsidise a one-time buyer?
This is the read no ad-account report can produce and no sale plan is complete without. It takes one Shopify export and an afternoon, and it tells you more than the sale-week chart ever will. Take the customers whose first order fell inside your last sale window. Take the customers who first bought at full price in the month before it. Compare their repeat rates at three and six months, by the first product each group bought.
Three rules make it honest. The cohort is defined by first-order date, never by which campaign the platform credits; there is no click-level join from an ad to an order, so "customers the BFCM campaign acquired" is not a thing anyone can measure. The comparison is by first product, because a sale cohort that repeats badly overall may contain one gateway product that repeats brilliantly. And it is Shopify order data only: no ad attribution is needed and none should be used.
If the sale cohort repeats like the full-price cohort, the discount bought customers and the acquisition job was done. If it repeats at a fraction, the discount bought orders from people who only buy on discount, or from people who were coming anyway, and next year's depth should be shallower, or the discount should move to the products that did repeat. Building the two cohorts is in cohort analysis for Shopify. This year's sale has no repeat window yet on the Monday after; read last year's now and calendar this year's for March and June.
The rule for the sale week: never scale on gross revenue
Every sale-week dashboard shows revenue climbing. Almost none shows what each discounted order left behind. A record revenue day at the wrong depth is a loss with a nice chart, so the rule that carries the week is: never scale spend because gross revenue is above normal. Scale on contribution pace against the margins you know, on the stock cover of the products the ads point at, and on delivery that is not piling into one ad set. The budget-versus-target levers on Meta and Google, and the three-phenomena rule for a mid-sale drop, are in the sale playbook. Which ROAS number settles which argument, and why a revenue multiple is not profit: Marketing ROAS decoded and what blended ROAS can't tell you. The marginal read, whether the last raise earned less than the average, is marginal ROAS, and it applies inside a sale week exactly as it does outside one.
What the platforms and the big players do, and what to take from it
Two published views are worth reading as their owners' work. Triple Whale's study across 20,000 brands found that top brands discount about 2.5x more than the rest, alongside its offer-testing guidance; it is an aggregate benchmark from a large portfolio, and it says nothing about what your product leaves at your depth. ROI Hunter's retail work put only around 60% of products selling at full price and built discount buckets, spend by discount level with a separate ROAS target per bucket, as catalog-feed engineering for retailers with thousands to millions of SKUs.
What a 50–500-SKU Shopify brand takes from each: from the first, that deep discounting is common at the top and is not by itself a mistake, provided the job and the depth are chosen. From the second, the bucket logic: if you must discount at different depths across the catalog, give each depth its own ROAS floor from the table above rather than one blended target, because a 40%-off product and a full-price product cannot share a break-even. Neither view has the customer dimension, which is why the cohort read above is the one that sets depth for a brand your size.
The decision worksheet
- Pick the job. Acquire, convert or clear. One per sale; if you need two, run two offers on two product sets.
- Set the depth from the table, on the margin you know for the products carrying the offer, with shipping and returns in.
- Choose sitewide or product-level. Pull last sale's returning-customer share from Shopify first. Acquisition discounts go on gateway products.
- Set the ad budget from the after-discount economics: margin left per order times the orders your stock can fulfil, not last year's revenue times a multiplier.
- Write the sale-week rule where you will see it: scale on contribution pace, stock and delivery spread, never on gross revenue.
- Test the redemption path from an ad click, on a phone, in the cart drawer, the day before.
- Read the returning-customer share daily during the sale; if it climbs past last year's, the discount is converting, not acquiring, and the budget should not.
- Define the post-sale reversion now: when the discount ends, how the budget steps down, and the exit condition for the hold that follows. The post-sale normalisation piece publishes on 1 December. Calendar the cohort read for three and six months out.
How Drew fits. Ask Drew which first-purchase products bring buyers back and which are one-and-done. Drew reads the unit costs you keep in Shopify and shows gross margin per product where at least 80% of what sold carries a cost; share shipping, fees, returns and the target you want decisions graded against, and its budget recommendations grade sale-week spend on what an order leaves after the discount, not on gross revenue. Repeat-driver products, cohort LTV by first product and conversational budget recommendations are live today. Drew does not set the offer, pause a SKU or change the budget for you. Cohorts in Datadrew are defined by first-order date and read by product, never by campaign.
To run the read on your own catalog, pricing is published and flat and the free plan doesn't need a card.
Key Takeaway
The discount comes off contribution before the ad dollar does, so a 50%-margin product needs 2.0x at full price, 2.7x at 20% off and 4.0x at a third off before shipping and returns, and the ad budget has to be set on the row you chose. Pick the job first: acquire justifies depth and gets read against the cohort it produces; convert should be shallow and small because most of its orders were coming anyway; clear is sized to units, not revenue. Sitewide discounts pay most to the customers who needed them least, and the returning-customer share of sale orders shows how much. Whether the sale bought customers who come back is readable at three and six months, by first product, from Shopify orders alone, and that read, not the revenue chart, sets next year's depth.
Frequently Asked Questions
How much should a Shopify brand discount during a sale when it's running Meta and Google ads?
Deep enough to do the job you picked (acquire, convert or clear) and no deeper than the margin you know can carry once the ad dollar is added. Discount comes straight off contribution: a product at 50% margin is at 37.5% margin at 20% off and 25% at a third off, so its break-even ROAS moves from 2.0x to 2.7x to 4.0x before shipping and returns. Set the depth from that table, then set the ad budget from what an order leaves after the discount.
Is a sitewide sale or a product-level discount better for paid ads?
Product-level, for acquisition. A sitewide discount pays its deepest price on returning customers who would have bought anyway; the share of last sale's orders that were returning, from Shopify, is the size of that subsidy. Put acquisition discounts on gateway products, the ones whose first-time buyers come back, and keep sitewide offers shallow and short.
How do I know if my sale brought in good customers?
Compare the three- and six-month repeat rate of customers whose first order fell inside the sale window with customers who first bought at full price the month before, by the first product they bought. Shopify order data only; cohorts are defined by first-order date, never by campaign. If the sale cohort repeats like the full-price one, the discount bought customers. If it repeats at a fraction, it bought one-time orders, and next year's depth should change.
What is break-even ROAS after a discount?
Margin left as a share of the discounted price is (margin % minus discount %) divided by (1 minus discount %), and break-even ROAS is 1 divided by that share. At 50% margin and 30% off, that is 28.6% and 3.5x. Then subtract shipping per order and the expected cost of returns, which raise the break-even further; the table above does it for one product at a time.
Should I keep discounting if the sale is losing money per order?
Only as a deliberate acquisition subsidy with a measured payback: the sale-window cohort, by first product, repeats strongly enough at three and six months to cover the first-order loss. Measure that from Shopify orders at product and cohort level, never per campaign, and set a floor on how far below break-even you will go and for how long. A clearance or a convert discount that loses money per order has no such justification.
Written by Sumit Bansal, co-founder of Datadrew. Published 16 September 2026. Quotes are linked to their sources inline or verified in Datadrew's operator research. Gross margin in Datadrew comes from the unit costs a merchant keeps in Shopify, shown only where cost coverage is high enough; contribution margin and targets are what the merchant confirms. Cohorts are defined by first-order date and read by product, never by campaign.