"hook rate is fine but conversions dropped — is that creative fatigue or a landing page problem?"
Founders put questions like that to ChatGPT and Claude, and this one comes word for word from our founder research. Whoever asks it is already halfway there: they suspect hook rate measures something other than sales.
If you run a Shopify brand, hook rate is probably the first number on your weekly creative slide. "Our hook rate is 31%!" gets a nod, and the meeting moves on. Meta now publishes the formula in its own Help Center, so the definition is settled. Two things aren't. The benchmark everyone repeats has thin roots, and hook rate on its own can't tell you whether an ad sells.
This is for founders and growth leads at $5M–$50M brands who want three answers: what good looks like, whether hook rate predicts sales, and what to do when the hook is fine and the orders aren't. It's part of our creative performance hub for Shopify brands.
Key Takeaways
- → Hook rate is 3-second video plays ÷ impressions, the formula Meta itself now publishes. Thumbstop ratio is an older name for the same number.
- → The famous ~30% hook-rate benchmark traces to a 2022 study of 11 accounts on a different short-video platform. The only large Meta dataset we found with a disclosed sample, Billo's H1 2026 study of 88,329 sales-objective video ads, averaged 25.44%.
- → A good hook rate is one above your own median for the same format and placement, read after 5,000 impressions. At 2,000 impressions per ad, a 2-point gap between two hooks is noise.
- → Hook rate grades the first three seconds and nothing after them. Read hold rate, CTR and conversion next, in that order, and judge sales on Shopify orders.
What hook rate and thumbstop ratio measure on Meta
Hook rate is the share of a video ad's impressions that turn into 3-second video plays: 3-second video plays divided by impressions. Meta's hook rate page says it measures "how well your video's opening 3 seconds grabs attention" and calculates it as "the number of three-second views divided by your video's total impressions, times 100." Thumbstop ratio, or thumb-stop rate, is the older industry name for the same number. Same ads, same dates, same formula: if your agency reports one and your dashboard the other, they should match.
The fine print matters more than most creative reviews admit. Meta's definitions of 3-second video plays and of video plays and ThruPlays spell out what counts:
- → A play counts at 3 seconds of video, or at 97% of a video shorter than that.
- → It counts how much of the video played rather than how much time passed.
- → Replays within the same impression don't count again.
- → A video play can start automatically or when someone clicks to play it. Neither definition requires the click, so an autoplay that runs 3 seconds meets the 3-second definition.
So hook rate tells you the opening held a thumb for three seconds. It doesn't tell you anyone chose to watch.
Hold rate is the second half: 15-second plays ÷ 3-second plays, the share of people who stopped and were still there at 15 seconds. Meta has no page for hold rate or thumbstop ratio, so every tool picks its own recipe, and at least three are in circulation:
- → 15-second plays ÷ 3-second plays. The one I use, and the one in this article.
- → ThruPlays ÷ 3-second plays.
- → Plays to 75% of the video ÷ 3-second plays.
Say which one you use before anyone compares numbers.
Then check the video length. Meta counts a ThruPlay at 15 seconds or, on a shorter video, once 97% of it has played, so on a 12-second cut every ThruPlay is effectively a completion and ThruPlay-based hold reads high next to longer videos. The 15-second version has the same blind spot: nobody is still watching at second 15 of a 12-second video, so under 15 seconds it can only count completions. Compare sub-15-second videos only with each other, and never compare hold across two tools without checking the formula.
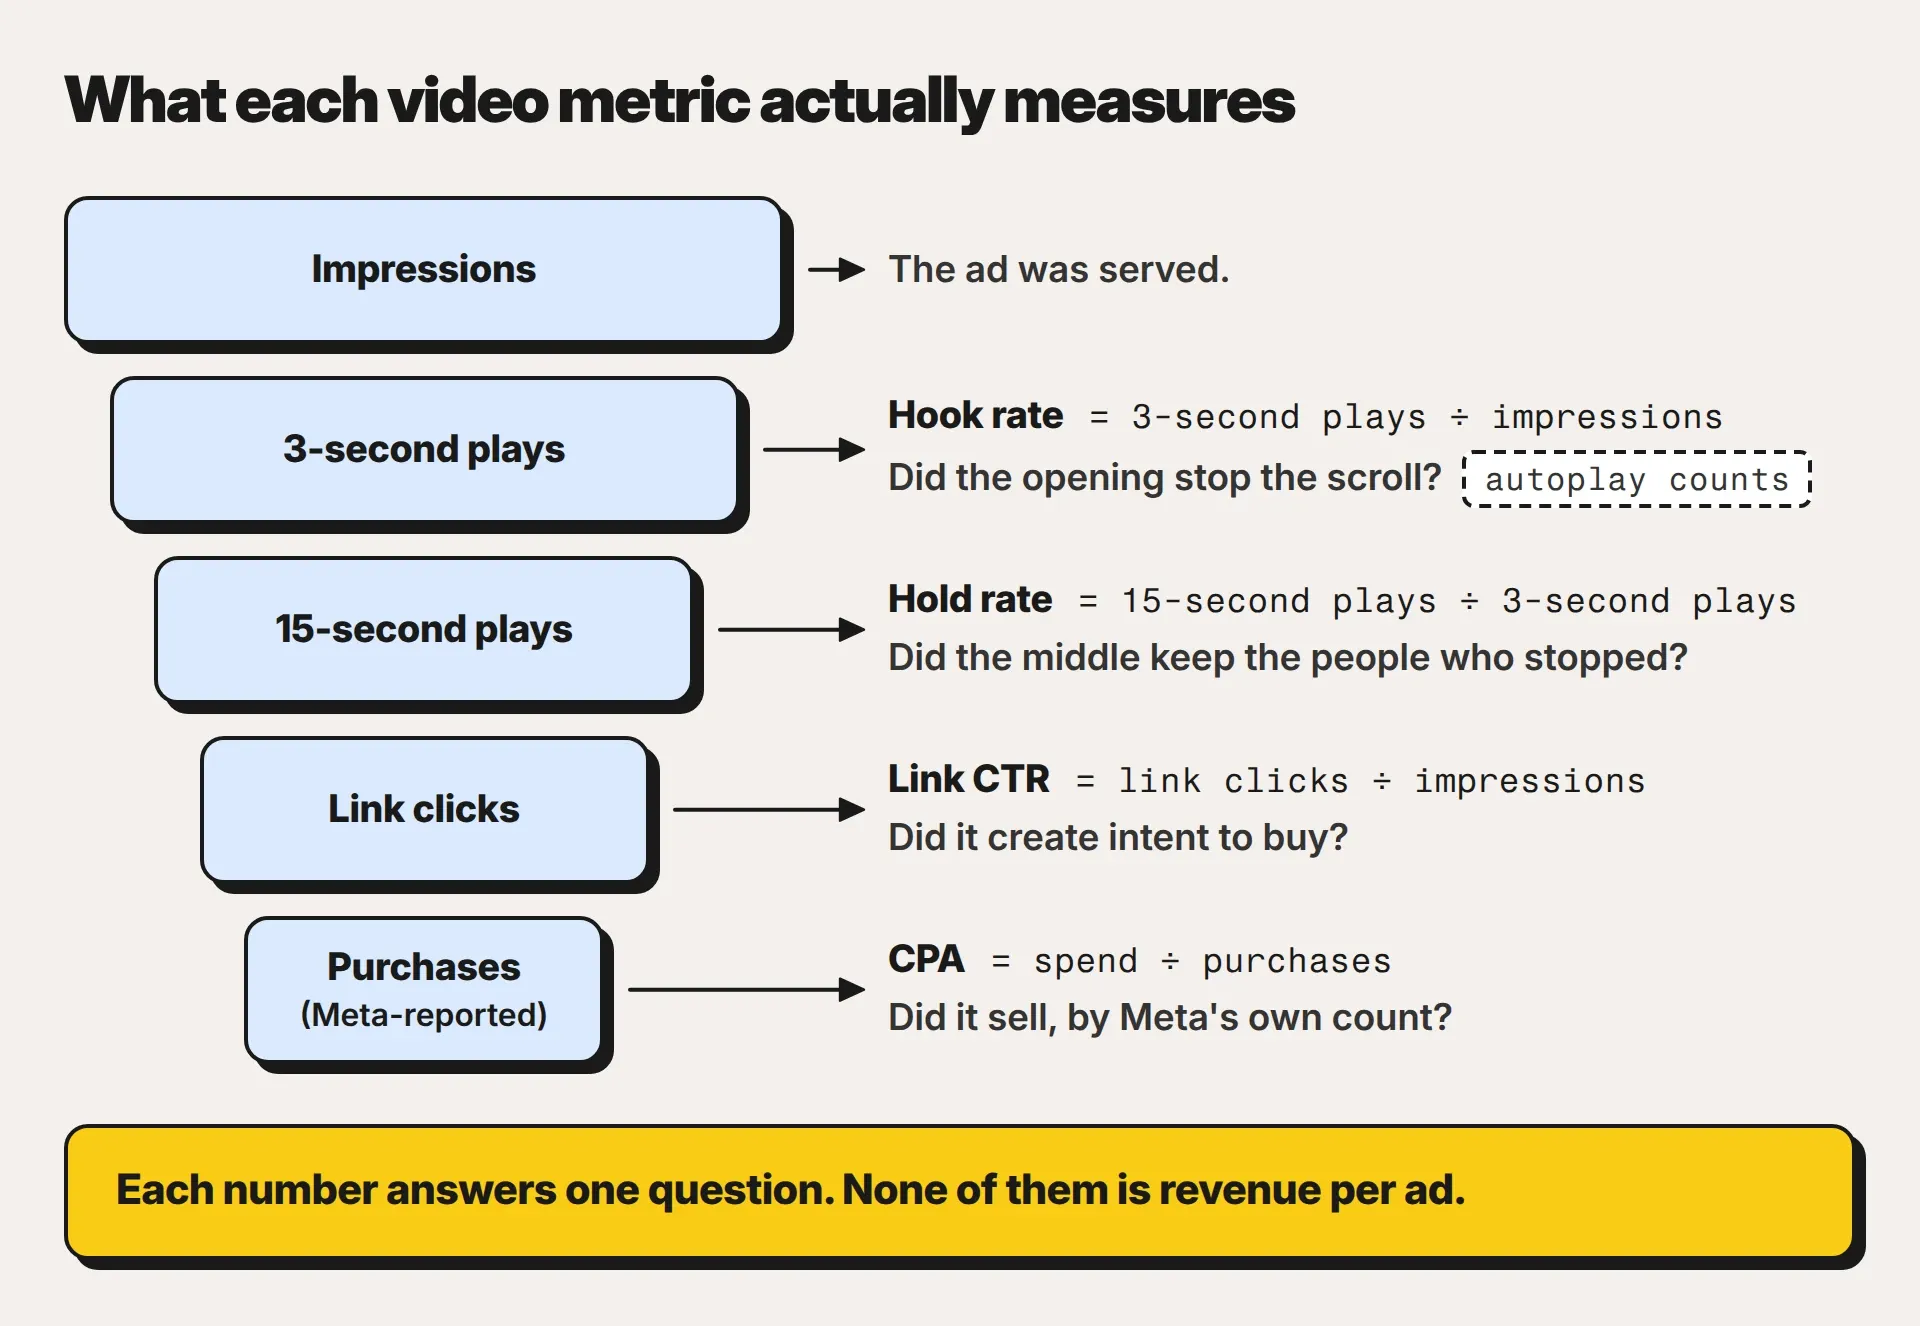
The whole chain in one table. Pin it next to the weekly report.
| Metric | Formula | The question it answers | Built from (Meta field) | Watch out for |
|---|---|---|---|---|
| Hook rate | 3-second video plays ÷ impressions | Did the opening stop the scroll? | 3-second video plays, impressions | Autoplay counts. Video only. Moves with placement, so compare Reels with Reels. |
| Hold rate (15s ÷ 3s) | 15-second plays ÷ 3-second plays | Did the middle keep the people who stopped? | 15-second plays, 3-second video plays | Not a Meta metric. Under 15 seconds it can only count completions. |
| ThruPlay-based "hold" | ThruPlays ÷ 3-second plays | The same question, from a different field | ThruPlays (15 seconds, or 97% of a shorter video) | Reads high on short cuts. Don't compare it with another tool's 15s-over-3s number. |
| Link CTR | Link clicks ÷ impressions | Did it make people want to click? | Link clicks (destinations on or off Meta) | Can include clicks that never leave Meta's apps. |
| Outbound CTR | Outbound clicks ÷ impressions | Did people actually leave for your site? | Outbound clicks (links that take people off Meta) | The cleaner click. The gap to link CTR shows how many clicks stayed on Meta. |
| CPA | Spend ÷ purchases (Meta-reported) | Did it sell, by Meta's own count? | Purchases, on Meta's attribution | Won't match your Shopify orders. Noisy under 15 purchases. |
What's a good hook rate? Where the 30% number comes from
Search "good hook rate" and 30% turns up on page after page. Follow the citations and most go nowhere, or to each other.
The most-repeated version, an average of about 30%, traces back to a 2022 study of 11 client accounts. It wasn't a Meta study: it measured a different short-video platform, and the original page now redirects elsewhere, so nobody can check the method today. Publishing it in 2022 was fine. Four years of repetition haven't turned it into a Meta benchmark.
Motion's 2026 creative benchmarks, built on 578,750 creatives, don't help either. They publish win rates and no hook-rate average at all, which hasn't stopped pages from citing them for hook-rate tiers.
The only large Meta dataset we found with a disclosed sample comes from Billo, a creator marketplace, and it doesn't say whose ads are in it. Its H1 2026 hook rate study covered 88,329 sales-objective Meta video ads with more than 1,000 impressions each, run between January and June 2026 on about $122M of spend, on the same formula. The average was 25.44%. By industry, averages ran from 21.32% for Animals & Pet Supplies to 28.79% for Toys & Games.
Placement is where the folklore is thinnest. Sources don't even agree on whether Reels beats Feed: several vendor pages put Reels a few points ahead, at least one puts it behind, and none discloses a sample. Billo's study makes no Reels-versus-Feed comparison.
A good hook rate is one above your own median for the same format and placement. Any other number describes somebody else's account.
How to grade hook rate against your own account
The fix for borrowed benchmarks is dull, and it works: build your own band, once a quarter. One export, a little spreadsheet gymnastics.
- → 1. Take 90 days of video ads with at least 5,000 impressions each.
- → 2. Split them by format and placement (9:16 Reels and Stories in one group, 4:5 or 1:1 Feed in another) and by cold versus warm audiences. Warm audiences already know you, so keep them out of the cold band.
- → 3. For each group, compute the 25th, 50th and 75th percentile of hook rate, plus the median hold rate.
- → 4. Read each new hook against its own group's band once it passes 5,000 impressions. Above p75 is a strong opening for your account. Below p25, rebuild the first three seconds.
The 5,000 floor comes from the math. A hook rate is a proportion, so its noise is binomial: the 95% margin is 1.96 × √(p × (1 − p) ÷ n). At a hook rate near 28%:
- → 2,000 impressions: ±2.0 points (1.96 × √(0.28 × 0.72 ÷ 2,000) ≈ 0.020)
- → 5,000 impressions: ±1.2 points
- → 10,000 impressions: ±0.9 points
Comparing two hooks, the gap has its own margin, about 1.4 times (√2) a single hook's: ±2.8 points at 2,000 impressions each, ±1.8 at 5,000. So two hooks at 27% and 29% after 2,000 impressions each are statistically the same hook. At 5,000 each, that 2-point gap only just clears the 95% bar. The same math prices a hook test in our Meta creative testing framework.
One trap: an account-level hook rate that divides by every impression, statics included, reads lower than a video-only number, because a static can't produce a 3-second play. Compare video with video.
Take Heathvane Goods, a sample account (illustrative numbers): a Shopify brand selling daypacks and slings, about $18M GMV a year, $186,400 on Meta in the last 30 days, target CPA $48. Over 90 days, its videos with 5,000+ impressions run p25 24%, median 29% and p75 35% on hook rate, with a median hold of 21%. Its account-level hook rate, statics included, reads 21%.
| Video (length) | Hook | Band position (points vs the 29% median) | Hold (median 21%) | Link CTR | CPA (Meta-reported; target $48) | Purchases (Meta-reported) |
|---|---|---|---|---|---|---|
| Trail POV hook (0:15) | 41% | Top quarter, +12 | 22% | 2.3% | $30.24 | 582 |
| Sarah's morning unboxing (0:21) | 38% | Top quarter, +9 | 27% | 2.6% | $23.14 | 1,400 |
| Rain test demo (0:18) | 36% | Top quarter, +7 | 25% | 1.8% | Still testing | 6 |
| Commuter sling UGC (0:24) | 33% | Above median, +4 | 23% | 1.7% | $35.80 | 176 |
| Founder story 15s cut (0:15) | 33% | Above median, +4 | 26% | 1.7% | $35.78 | 109 |
| Dog trail walk (0:19) | 31% | Above median, +2 | 20% | 1.5% | $40.83 | 120 |
| Customer review montage (0:30) | 29% | At median, 0 | 21% | 1.6% | $38.13 | 257 |
| Founder story 60s (1:00) | 27% | Below median, −2 | 19% | 1.10% (7-day peak 1.67%) | $45.39 | 401 |
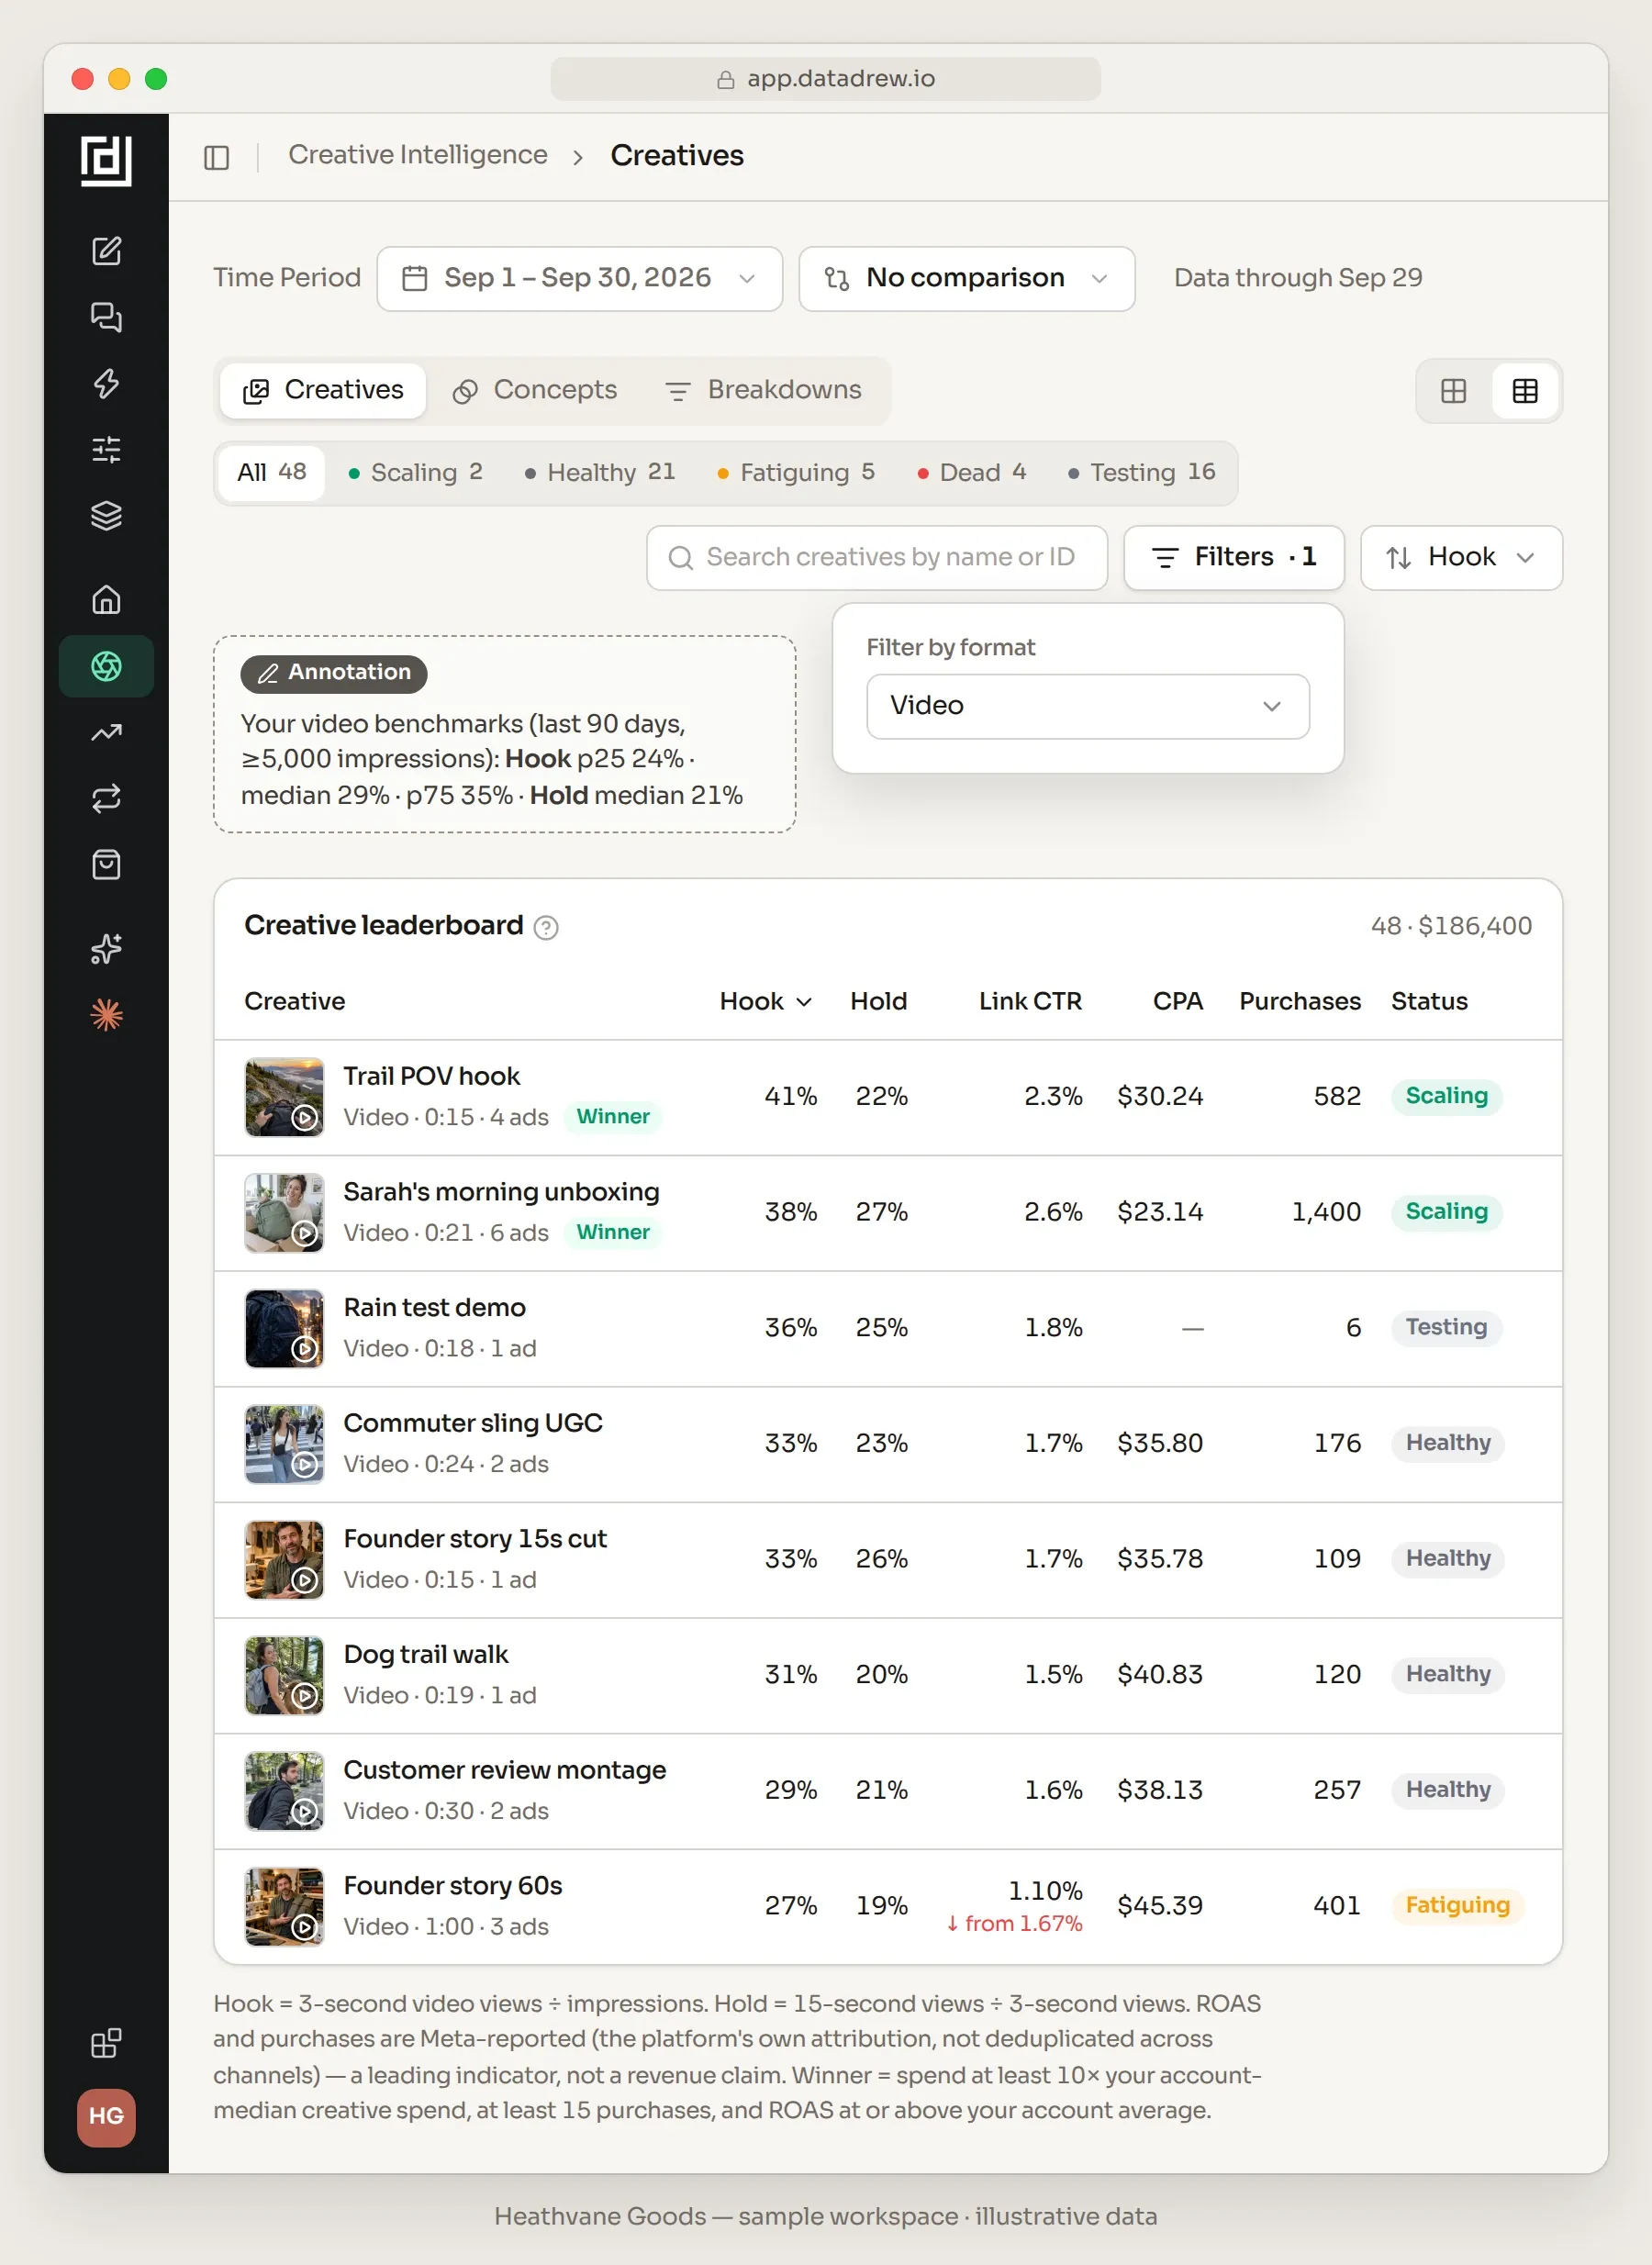
Three things stand out.
- → The two best CPAs aren't in hook-rate order. Sarah's morning unboxing has the best CPA in the table, $23.14, with the second-best hook (38%). Trail POV hook opens harder at 41% and pays $30.24. The unboxing wins on what happens after the hook: best hold (27%), best link CTR (2.6%).
- → In this sample, link CTR lines the videos up by CPA almost exactly. Hook rate doesn't: Customer review montage (29% hook) buys at $38.13, cheaper than Dog trail walk (31%) at $40.83. One illustrative account proves nothing. It's still the first pattern to check in yours.
- → Rain test demo's 36% sits above the p75 and says nothing yet about sales. Six purchases is well short of the 15 I want before reading a CPA. The opening works. Whether the ad sells is still open.
Now look at what Billo's average would have told you. Every video in this table beats 25.44%. Against the account's own band, Founder story 60s (27%) sits in the bottom half, and it's the one that's tiring: link CTR down from a 1.67% peak to 1.10%.
What hook rate can't tell you about sales
Hook rate is a first-three-seconds diagnostic, not a sales metric. It tells you whether the opening held the scroll. It can't tell you whether that attention came from buyers, whether the middle made the case, or whether the page closed it.
The only public test of hook rate against outcomes we found comes from Funnel Insiders. It covered 26 client accounts that spent about $1.5M in Q1 2024 and analyzed 403 of their ads. Thumbstop ratio showed essentially no relationship with ROAS (R² of 0.003) or CPA (R² of 0.007). In plain English, hook rate explained about 0.3% of the variation in ROAS. It isn't ecommerce: the data came from a direct-response info-product business. The lesson transfers anyway. Attention is necessary. It isn't sufficient.
The hard version is attributed to Taylor Holiday, CEO of Common Thread Collective, in an X post from March 2024: "'Engagement' has no impact on performance." I'd put it less absolutely. An ad nobody stops for can't sell anything. But no hook rate ever paid a supplier.
There's a harder limit underneath. All the creative metrics in this article are Meta-reported, and CPA and ROAS rest on Meta's attribution rather than your Shopify orders. Datadrew has no click-level join from an ad to an order either, so we won't hand you revenue per ad. Our hub draws that line in full in what creative data can and can't tell you. Judge sales where they happen: Shopify orders, at account and product level.
Read hook rate with hold rate, CTR and conversion, in that order
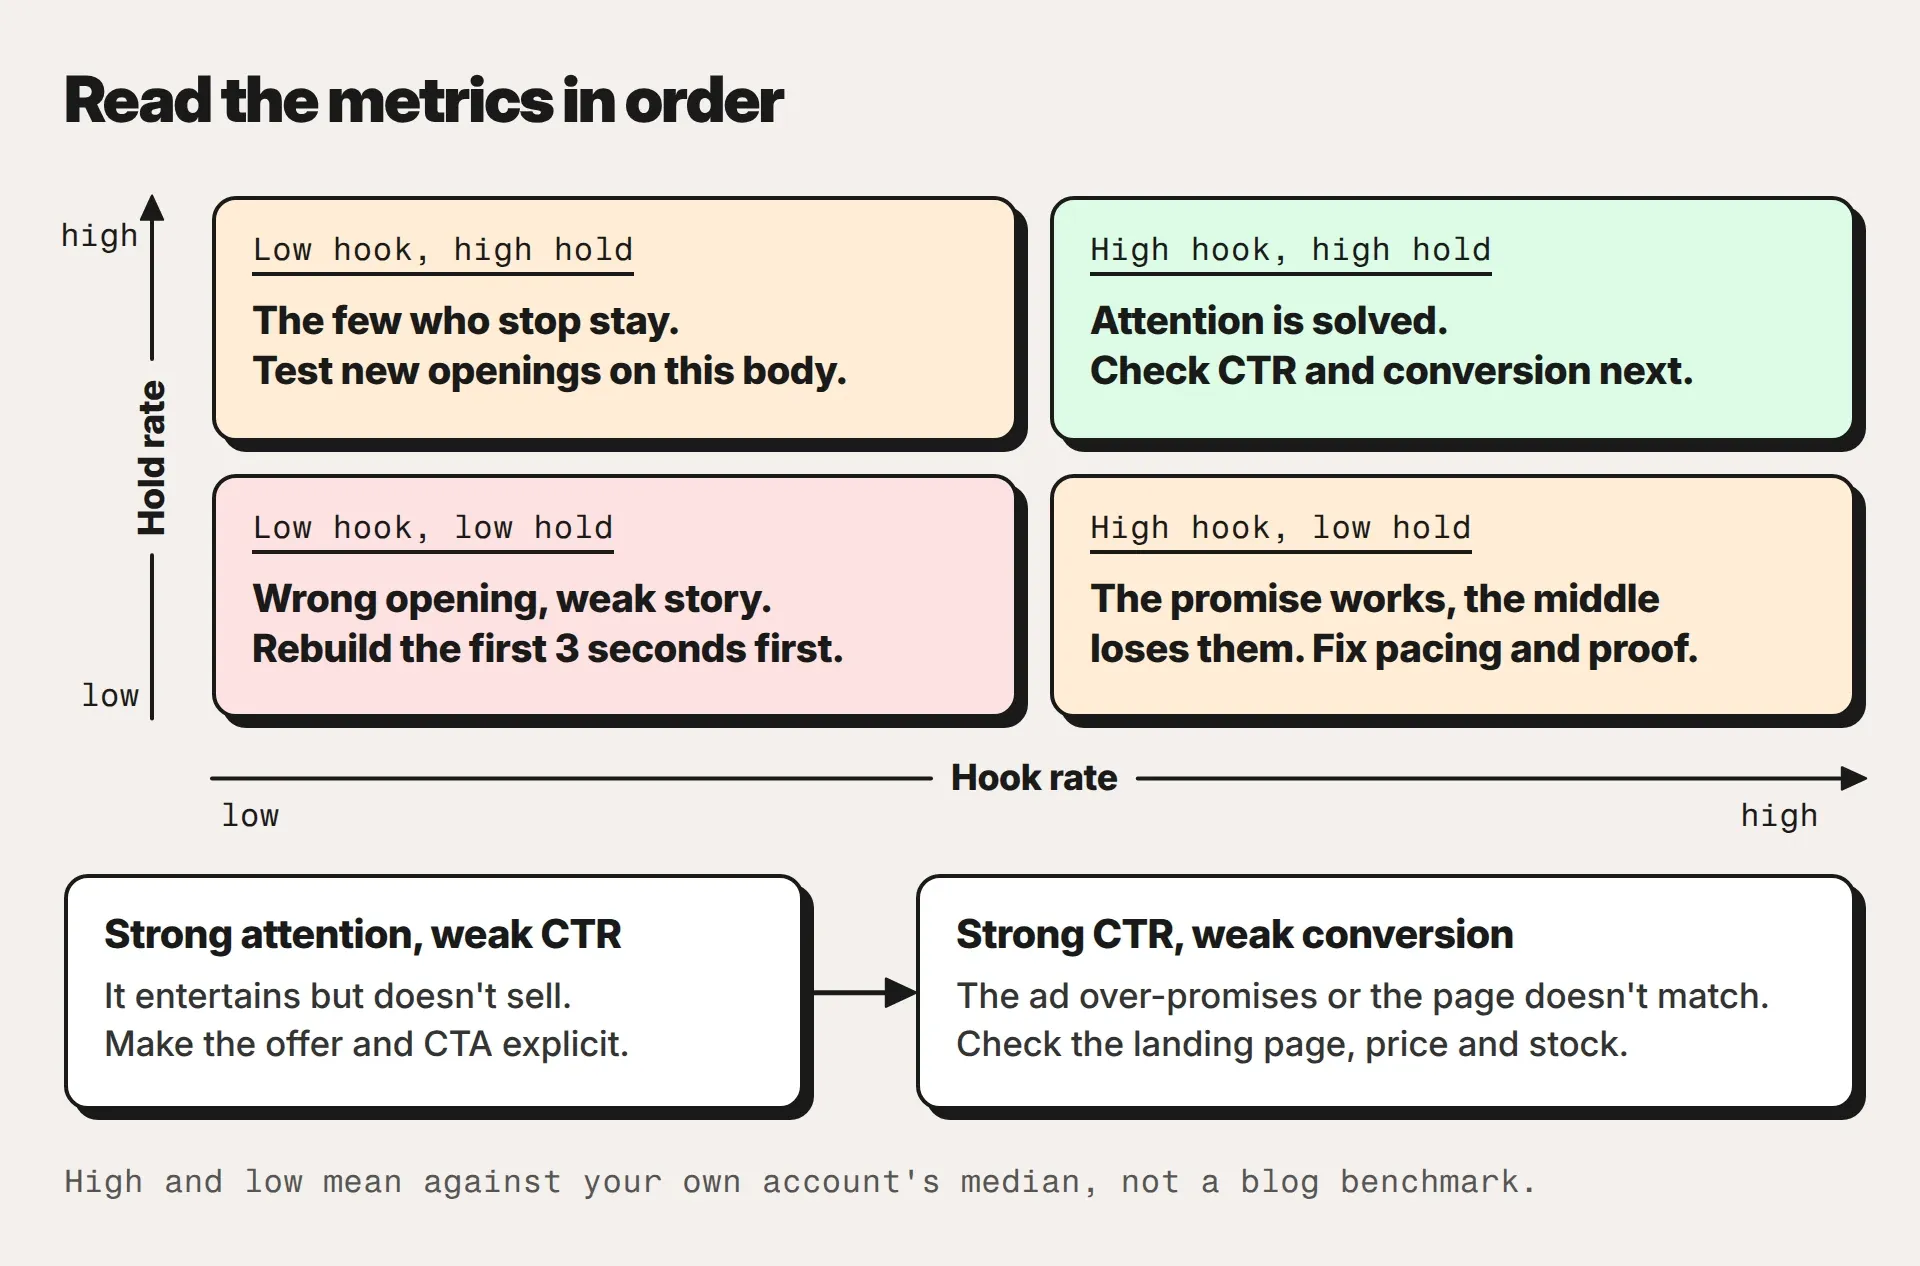
Read the four numbers in the order a viewer meets them and stop at the first one that breaks. That's where the fix lives.
| What you see | What it means | What to change |
|---|---|---|
| Low hook (below your p25) | The opening doesn't stop people | Rebuild the first 3 seconds: new first frame, new first line. If hold is fine, keep the body. |
| High hook, low hold | The promise works; the middle loses them | Fix pacing and proof in the middle. Keep the opening. |
| Low hook, high hold | The few who stop, stay | Test new openings on this body. |
| Strong attention, weak CTR | It entertains but doesn't sell | Make the offer and the call to action explicit. |
| Strong CTR, weak conversion | The ad over-promises, the traffic is weak, or the page, price or stock doesn't match the ad | Check the landing page, price and stock before you touch the ad. |
| Strong conversion, little delivery | Not enough evidence or budget yet, or your own winners are taking the auctions | Give it budget, then wait for 15 purchases before judging. |
Now the question from the top. If hook rate and link CTR held steady and conversion fell across several ads at once, look at the page, the price and the stock before you touch the creative: a bestseller out of stock in the main size, a price change, a slower checkout. Start with why add-to-carts aren't checking out, then the offer level of creative fatigue, where the ads still work and the sale doesn't.
If CTR fell on one ad while its frequency climbed, suspect fatigue and confirm it with the two-condition test I use: link CTR 30% or more below the ad's own 7-day peak with frequency at 2.5 or above, or 7-day cost per purchase at 1.5× or more of its own 30-day baseline while it's still spending. A CTR dip on its own isn't fatigue. Then work out which of the four levels is tired: the ad, the concept, the audience or the offer.
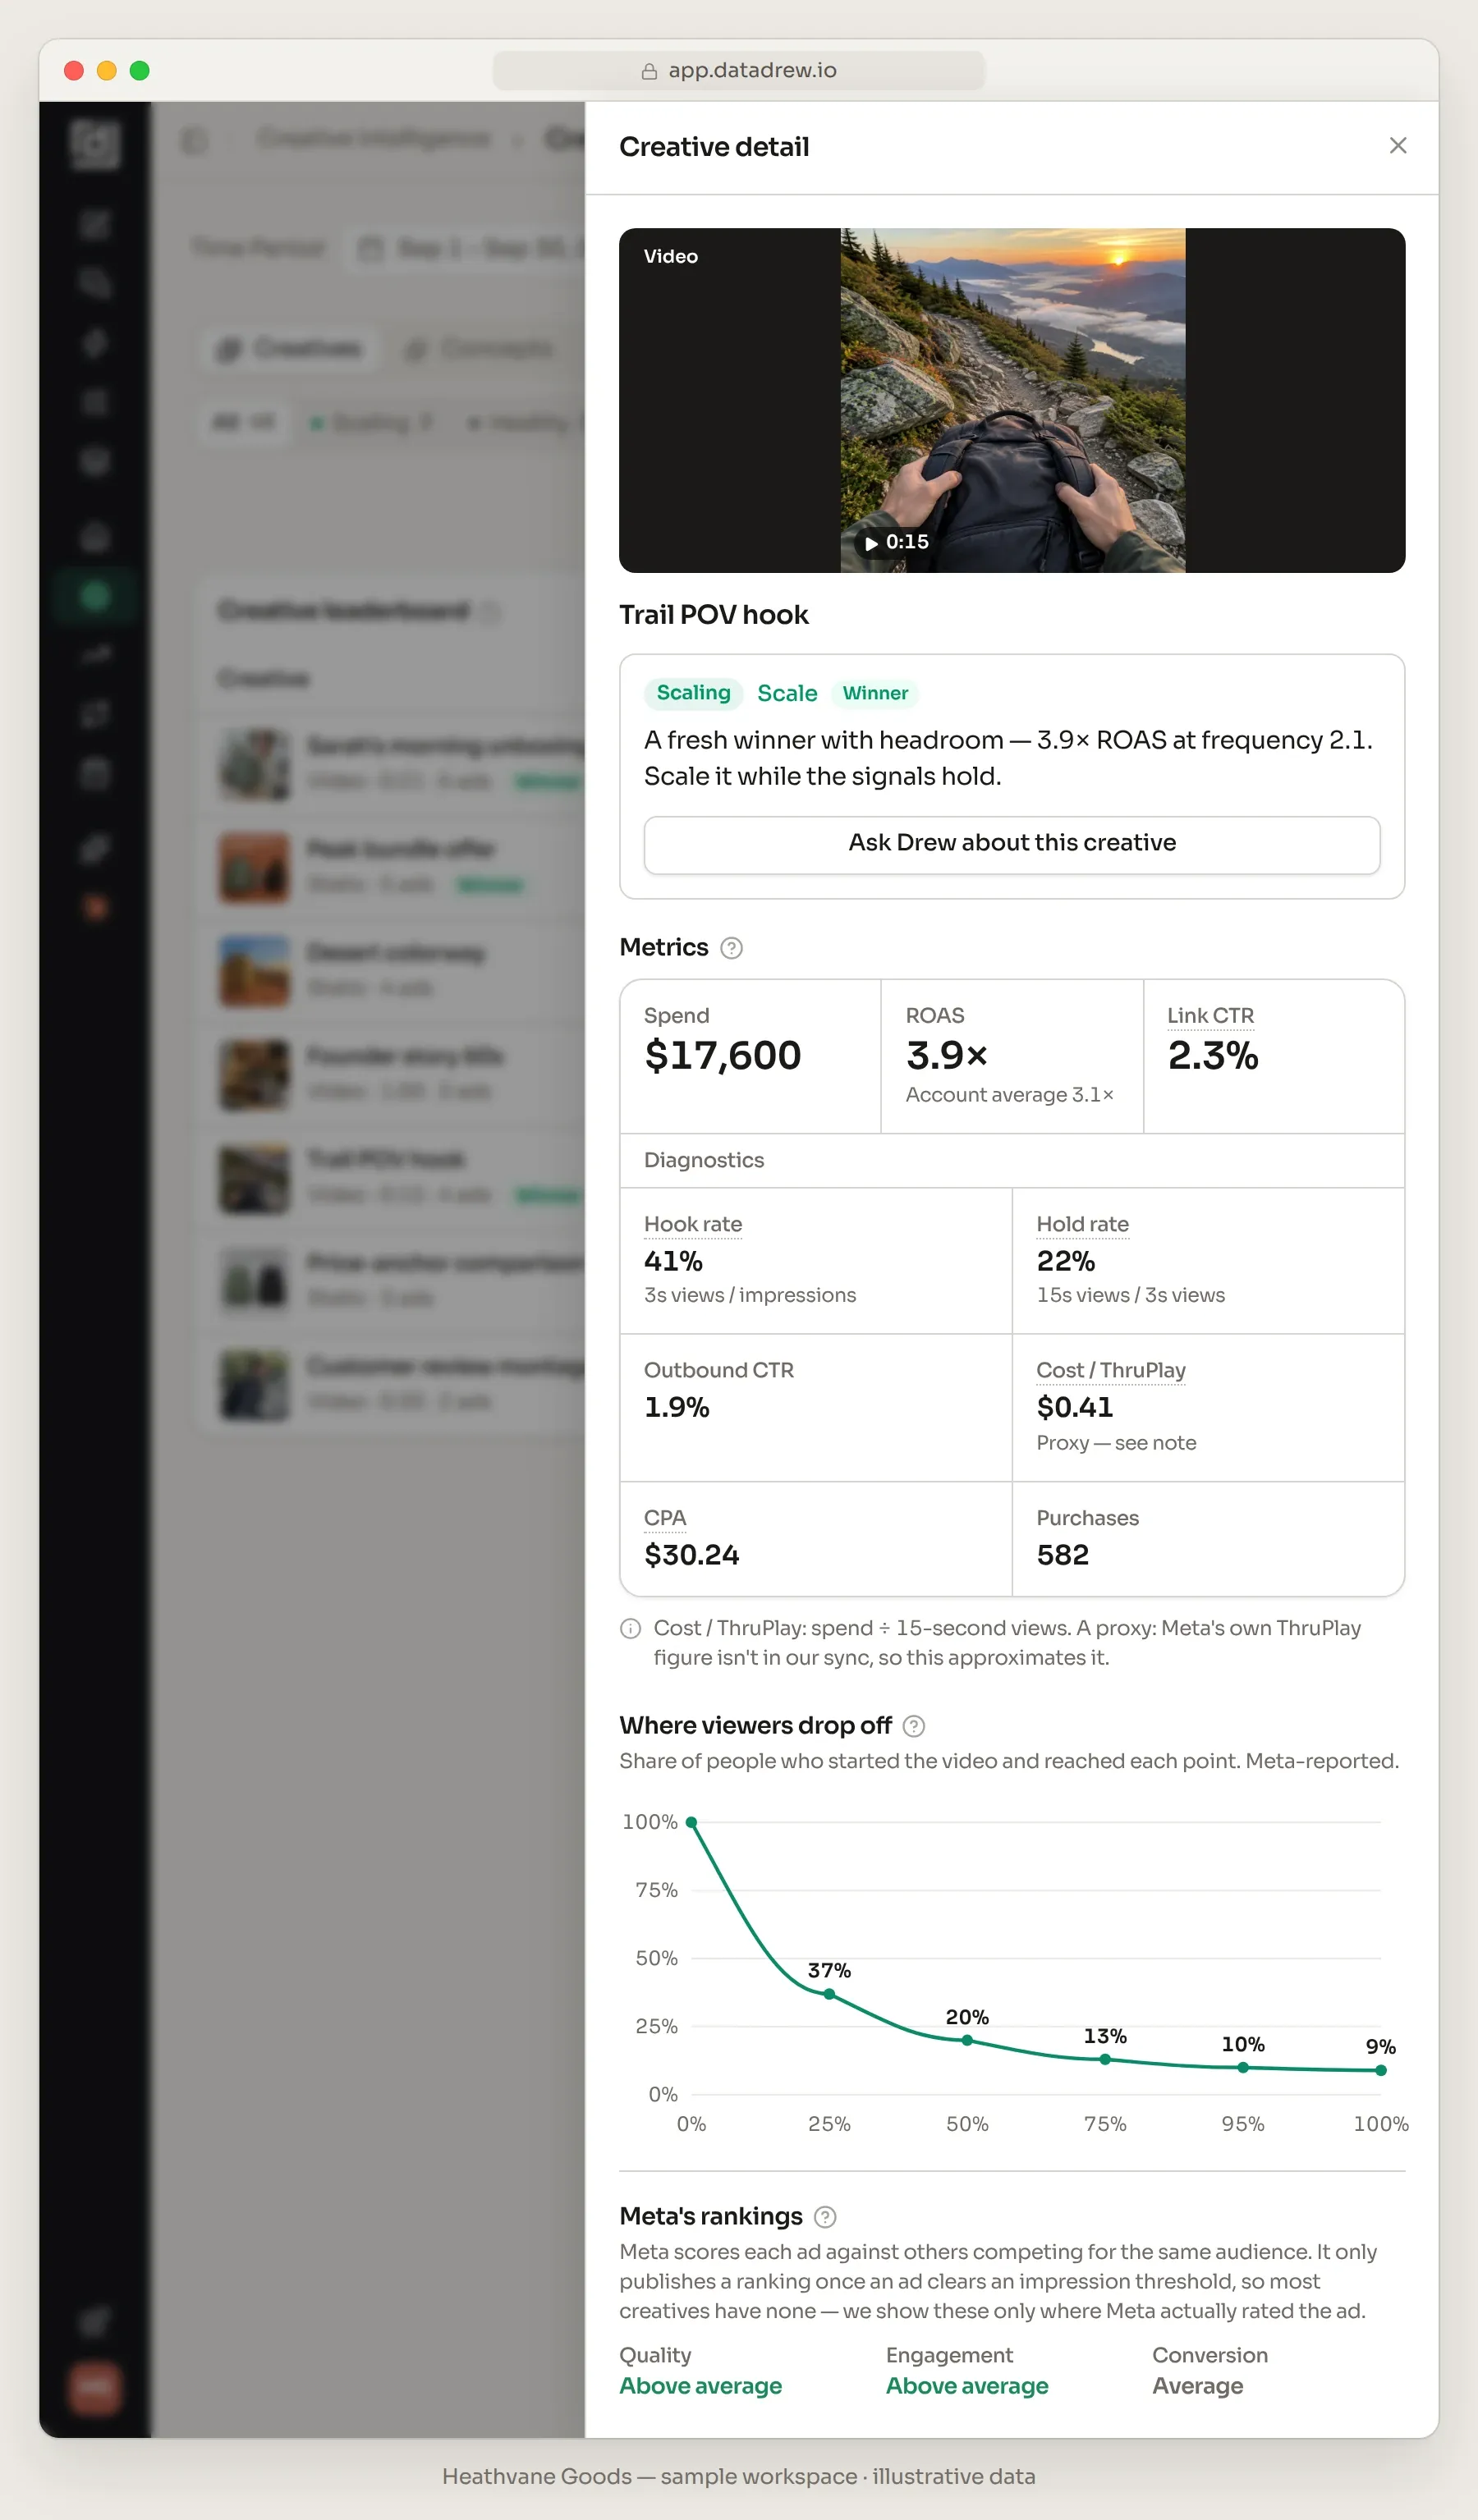
Run the order on the sample account's best opener. Trail POV hook runs a 41% hook rate, above the account's 35% p75, and a 22% hold, about the 21% median. Strong opening, ordinary middle. The drop-off curve shows the leak: 37% of plays reach the quarter mark, roughly second 4 of a 15-second video, and only 20% reach halfway. And an outbound CTR of 1.9% against a 2.3% link CTR says some of those clicks never left Meta.
It's a Scaling winner at 3.9× ROAS (Meta-reported), so don't edit the live ad. Brief two new middles that keep the first three seconds frame for frame (here's a brief format a media buyer will actually use) and judge them on hold rate against the 21% median, then on CPA.
Static and carousel ads have no hook rate
Hook rate is video-only. A static can't produce a 3-second play, so never average statics into a hook-rate number. Plenty of statics win anyway. Heathvane's third winner, Peak bundle offer, is a static: 873 purchases at a $32.76 CPA, Meta-reported, and no hook rate at all.
For statics, read three things instead:
- → Link CTR and outbound CTR against your static median. Never against your video median.
- → CPM, a rough read of how the auction prices your ad against others chasing the same people. It also moves with audience and season, so compare statics from the same ad set and the same weeks.
- → Meta's quality ranking, where it shows. Meta's relevance diagnostics compare your ad with "ads competing for the same audience", appear only after 500 impressions, and "aren't inputs into the ad auction." Meta's own guidance on using them adds: "Sometimes high performing ads have below average ad relevance diagnostics rankings and that's OK." Treat the ranking as a hint.
Carousels are the trap. When a carousel carries video cards, Meta sums the video metrics across the cards, so its "hook rate" isn't one opening's hook rate. Keep carousels out of the video band and read them like statics.
The rest of the creative cycle, from briefs to fatigue to competitor research, lives in the full guide to creative performance for Shopify brands.
How Drew fits. Datadrew locks in both formulas from this article: hook rate = 3-second views ÷ impressions, hold rate = 15-second views ÷ 3-second views. So the number on the dashboard is the number Drew quotes, in the app, in Slack or in Claude via MCP. Open a video for its drop-off curve at 25/50/75/95/100%, outbound CTR, cost per ThruPlay (a proxy: spend ÷ 15-second views) and Meta's quality, engagement and conversion rankings where Meta publishes them, all Meta-reported and labeled so. The free plan shows these metrics. Paid plans add verdicts graded against your account's own baselines, and Breakdowns: spend and Meta-reported ROAS by one tag at a time, such as hook type or visual hook device, with tag coverage stated on the page. Our table figure's band is an annotation; ask Drew for yours: "Which videos beat our median hook rate but miss our target CPA?" Three limits. The summary's account-level hook rate divides by all impressions, statics included, so it reads lower than a video-only hook rate. Data is daily, through yesterday. Drew writes the brief for a new middle as text; it doesn't make the video. See how the creative view works.
Key Takeaway
Hook rate is the share of a video ad's impressions that turn into 3-second video plays: 3-second video plays divided by impressions. Meta's Help Center now publishes that formula, and thumbstop ratio is an older name for the same number. It's a first-three-seconds diagnostic, not a sales metric. A good hook rate is one above your own account's median for the same format and placement, read after at least 5,000 impressions; the widely repeated ~30% traces to a 2022 study of 11 accounts on a different short-video platform. Read hold rate (15-second plays ÷ 3-second plays), link CTR and conversion next, in that order, and judge sales on Shopify orders.
Frequently Asked Questions
What is a good hook rate for Meta ads?
A good hook rate is one above your own account's median for the same format and placement, read after at least 5,000 impressions. The only large Meta dataset we found with a disclosed sample, Billo's H1 2026 study of 88,329 sales-objective video ads, averaged 25.44%, with industry averages from 21.32% to 28.79%. The widely quoted 30% traces to a 2022 study of 11 accounts on a different short-video platform, so don't treat it as a Meta target.
What is the thumbstop ratio, and is it the same as hook rate?
Yes, it's the same number. Thumbstop ratio, also written thumb-stop rate, is the older industry name for 3-second video plays divided by impressions, which Meta's Help Center now calls hook rate. If two reports disagree for the same ads and dates, check the denominator: an account-level figure that counts static impressions reads lower.
What's the difference between hook rate and hold rate?
Hook rate asks whether the opening stopped the scroll: 3-second plays ÷ impressions. Hold rate asks whether the middle kept the people who stopped: 15-second plays ÷ 3-second plays. Hold rate isn't a Meta metric, and tools build it at least three ways (15-second plays, ThruPlays or plays to 75%, each over 3-second plays), so check the formula before comparing. On a video shorter than 15 seconds, it can only count completions.
Does hook rate count autoplay views?
Yes, going by Meta's own definitions. Meta says a video play can start automatically or when someone clicks to play it, and it counts a 3-second play each time the video has played for 3 seconds (or 97% of a shorter video), excluding replays; neither definition requires a click. So hook rate tells you the video played through its opening three seconds. It doesn't tell you anyone chose to watch.
Our hook rate is fine but conversions dropped. Is it creative fatigue or the landing page?
Check whether the drop sits in one ad or across several. If hook rate and link CTR held steady and conversion fell across several ads at once, look downstream first: the landing page, price, stock or offer. If one ad's link CTR fell 30% or more below its own 7-day peak with frequency at 2.5 or above, or its 7-day cost per purchase reached 1.5× its own 30-day baseline while it kept spending, that ad is fatiguing and needs a new version.
Do static ads have a hook rate?
No. Hook rate needs a 3-second video play, so statics and image carousels don't have one, and averaging them into a hook-rate figure drags it down. Read statics on link CTR and outbound CTR against your static median, on CPM, and on Meta's quality ranking where it appears (after 500 impressions).
Written by Sumit Bansal, co-founder of Datadrew. Published 30 September 2026. Meta platform facts checked against Meta's Help Center on 30 September 2026; third-party figures are named and linked where they appear. Worked examples use a sample account with illustrative numbers. Datadrew deals in realized numbers with Shopify orders as the source of truth; we don't adjudicate which channel or creative deserves credit for a sale.